
Network performance is a very important aspect of digital communication that is greatly affected by latency. Having an understanding of how to test network latency is important as it promotes reliability and faster connections.
In this blog, we are going to look at what network latency is and why it is important to know about it. We will also look at the various types of latency, the causes of network latency, and how to check, measure, and test it. We have a look at how to troubleshoot network latency issues and best practices for monitoring and improving network latency.
What is Network Latency & Why is it Important?
Network latency refers to the time taken for data to be transferred across a network. A higher latency is seen in networks with longer data transfer times or delay, and those with shorter times or delay have lower latency and thus offer faster responses. Low latency is ideal for business and is convenient compared to higher latency.
Latency is important as many organizations and economies are going digital, and thus the usage of cloud services, the internet, and so many other digital services has rapidly increased, all of which rely on networks. Real-time applications like streaming apps, real-time data management, APIs, etc., require low latency as they depend on real-time actions and require instant feedback.
High latency, on the other hand, is a bottleneck as it results in slow speed, inconvenience, and slow loading times. This drives away clients who end up opting for alternatives and better solutions with higher speeds associated with low latency.
Types of Latency
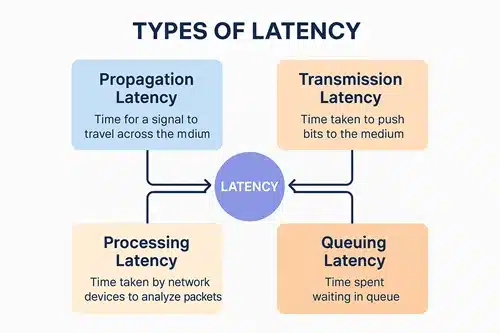
There are mainly four types of network latencies/delays that developers face. They include propagation latency, transmission latency, processing latency, and queuing latency. Every one of these increases the total delay in network communications. Let’s look at each one of them in detail below.
-
Propagation Latency
Propagation latency refers to the time taken for a signal to physically travel across the medium. The medium includes fiber-optic cables, copper wires, or wireless communication channels.
-
Transmission Latency
Transmission latency refers to the time taken to push bits to the network wire or medium. It depends on the size of packets and link speed.
-
Processing Latency
Processing latency refers to the time taken by routers, switches, firewalls, or end devices to analyze packet headers and make forwarding decisions.
It is influenced by factors like the complexity of routing rules, encryption/decryption overhead, and intrusion detection systems (IDS) and firewalls. Here the more the number of the network network devices, the higher the processing latency cumulatively.
-
Queuing Latency
Queuing latency is a network delay that arises due to packets waiting in line inside routers/switches mainly because of traffic congestion.
It is mainly common during peak hours, as a lot of packets, reach the router and fill its buffer. Newly arriving packets wait in a queue thereby increasing delay. This delay can even result into packet loss when the delay is too long as the packet may be dropped.
Latency vs Throughput vs Bandwidth

Latency, Bandwidth, and Throughput, and related concepts that tend to confuse many individuals, yet they all measure different network features. Now that we understand what latency is, let’s explore the other two.
Throughput
Throughput is the average amount of data that passes through a network over a given period. It is measured in bits per second, or at times, data per second.
Given a network connection with a high latency, this network can have a lower throughput, as data takes longer to transmit and arrive. Low throughput also makes it look as if a network has high latency, as it takes longer for large amounts of data to reach their destination. So both latency and throughput need careful monitoring to achieve higher and better network performance.
Example
Let’s say your internet plan is 150Mbps, and during peak hours it goes to 125Mbps. This 125Mbps is the throughput. Throughput is usually lower than the bandwidth due to congestion.
Bandwidth
Bandwidth is the measure of the maximum amount of data that can pass through a network at any given time. It is measured in data units per second, for example, megabits per second (Mbps) or gigabits per second (Gbps). It does not measure speed as many confuse it, but instead it measures capacity. Though it can facilitate faster internet speeds when considered together with throughput and latency.
Example
So if your home internet says 150Mbps, this is the bandwidth. Bandwidth can be simply explained by comparing a two-lane road and a four-lane road. The four-lane road allows more cars to drive in it at the same time than a two-lane road, hence it has a higher bandwidth than the two-lane road.
Also, note that high bandwidth does not guarantee speed or good network performance, but a higher bandwidth leads to higher throughput.
All in all, latency measures response time, while throughput and bandwidth measure data passed across a network over time.
Causes of Network Latency
In this section, let’s look at what causes delays in networks. These delays result in even fast systems and applications becoming slow, especially if the latency is high. Some of the causes include the following.
-
Transmission distance.
If the distance between two transmission endpoints is long, there is usually an increase in latency. Let’s say given system or application servers are geographically far away from the location of end users, these users will experience more latency than users who are near the servers.
-
Size of data packets and congestion.
Suppose a large number of data packets are being received by a network device concurrently. In that case, latency increases because the device has limited processing capacity and hence resulting in queuing and transmission delays.
-
Transmission medium.
The data transmission link has a greater impact on latency. For example, networks that use fibre-optic tend to have low latency compared to ones that use wireless technology.
-
Server response time.
The performance of an application server affects network latency. Here, the delays are due to the slow response time of the servers.
-
Number of network hops.
As data is transmitted over a long distance, it hops between multiple network devices, for example, routers or switches. This, in the long run, adds a bit of processing time. If there are many hops in the network path, latency increases.
Why is it Important to Test Latency?

Testing latency is important as it is not just about knowing how much your network delays to respond, but mainly about ensuring your application has a smooth and fast performance, identifying delays before they affect the user experience, and also ensuring quality service provision. Below are the detailed, notable reasons why one should test latency.
-
Testing latency ensures smooth and optimal performance.
Video conferencing, online gaming, VoIP, and financial trading systems are some of the applications where real-time data transfer is heavily used. In these applications, even small increases in latency can lead to delays or buffering. These delays could result in losses and inconvenience to users.
When latency is tested to be high, technical teams work hard to troubleshoot and minimize or remove it so as to avoid user inconvenience and losses that could emerge.
-
Helps detect bottlenecks before they affect users.
An increase in latency may be a sign that there is network traffic congestion, network misconfiguration, or network hardware issues. Random or usual latency checks enable technical teams to know of such bottlenecks early and reroute traffic to faster paths before users even notice.
-
Testing latency makes troubleshooting faster during latency spikes.
In scenarios where there is a spike in latency, testing latency helps narrow down the main cause of the problem based on what type of latency is being experienced and what could be causing it. This speeds up troubleshooting as it makes it easy for engineers to know where the problem is arising from.
Now that we understand the importance of testing network latency, let’s have a look at how to do it practically in the next sections.
How to Check Network Latency

There are various methods to test and measure network latency. The method one chooses usually depends on whether he/she need a basic latency check or an in-depth performance check.
-
Using the Ping command
Using the
pingcommand is the most common and simplest method of checking network latency. This method works by sending packets to a destination host and measuring the Round-Trip Time (RTT).bash ping google.comWe can see how to use it practically in the section How to test Latency with a Ping Command.
The ping command helps us know the average time (in milliseconds) it takes for a packet to travel to the destination and back, and also shows us packet loss in case of any.
You can use the
pingcommand if you want to do a quick connectivity test or check latency to a server or website. -
Using Traceroute
The
traceroutecommand (ortracertin Windows) is used to identify where in the network path delays are happening.traceroute google.com #macOS/Linux tracert google.com #WindowsThis command helps show each hop (router/switch) that data packets pass through, and the latency to each hop along the route.
tracerouteis used to troubleshoot slow networks or point where congestion or packet loss is occurring. -
Using Network analyzers/tools
Network analyzers give a detailed view into latency and packet loss. They monitor traffic continuously and provide advanced analytics and insights. They include Wireshark, NetScout, SolarWinds Network Performance Monitor, and so on. You can use network analyzers when you want in-depth insights and while diagnosing complex network issues.
-
Using Cloud-based monitoring services
These are tools that simulate end-user traffic from multiple global locations and measure latency. They include Datadog, ThousandEyes, and so on. Their major advantage is that they enable you to test globally, from multiple regions. They can also be integrated with DevOps tools and can provide continuous monitoring and send alerts in case of latency spikes.
You can use cloud-based monitoring services for web apps serving global users, and when validating cloud/ISP latency performance.
How to Measure Network Latency
When latency spikes, it is usually important to measure it. Latency is measured as Round Trip Time (RTT). RTT is defined as the total amount of time it takes for a request to go from the client to the server and back. Tools like ping give you a quick view of RTT. The formula below can be used to calculate latency
$$\text{Latency} = \frac{\text{Time packet returns} – \text{Time packet sent}}{2}$$
How to Test Latency with a Ping Command
Earlier, we looked at the ping command. Here, let’s have a practical look at how to use it to test latency.
Firstly, choose a target to test for latency. This can be your router, a public DNS, or a website/app you care about. For example, in this case, we will use google.com
Access your terminal or command prompt. Run the command below.
bash
ping google.com #Windows
ping -c 4 google.com #mac)S/LinuxThe above command sends small packets to the Google server and measures RTT. This is shown in the image below.
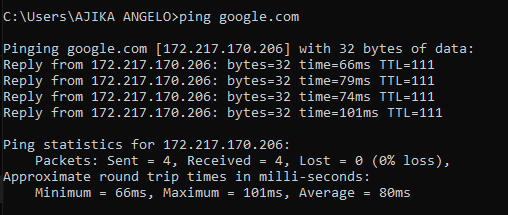
From the image, each line shows a single packet response Reply from 172.217.170.206: bytes=32 time=66ms TTL=111. bytes=32 represents the size of the packet sent, time=66ms represents the latency of this packet in milliseconds, and TTL=111 represents the remaining hops before the packet would expire.
In the image, the 4 packets sent returned with times, 66ms, 79ms, 74ms, 101ms. The ping summary in the image mentions 0% loss, which means that all packets reached the server successfully. The Minimum/Maximum/Average gives a clear view of typical network latency.
Therefore, the average latency to google.com is 80ms, which is acceptable for most online activities like browsing, video calls, or cloud work. Spikes like 101ms indicate occasional network congestion along the path.
How Network Analyzers Help Test Network Latency
Even though the ping command is a quick and simple way to check latency, it only gives basic RTT. If one is interested in a detailed view of the network performance, he or she has to use network analyzers. Tools like Wireshark, SolarWinds, and NetScout give detailed and advanced insights that help engineers troubleshoot, monitor, and optimize networks.

Key Benefits of Network Analyzers
-
Network analyzers offer detailed packet-level analysis. They capture and inspect every packet that is moving on the network, identify delays, and filter specific IP addresses to see latency per packet.
-
They help identify network bottlenecks as they analyze which routers, switches, or links are causing delays and also detect congestion points before they impact end users.
-
They are used for tracking latency trends for a specific period. This helps identify latency patterns.
-
Network analyzers provide visuals via graphical dashboards. These can help in spotting peak usage times, spikes, and rare traffic.
How to Reduce Network Latency
Below are some strategies that one can implement to reduce network latency.
-
Instead of wireless communication, use wired connections.
Wired Ethernet connections are more stable and consistent than wireless connections. For example, when using Wi-FI, there tends to be interference, signal drops, and packet retransmission, all of which increase latency.
-
Improve database performance.
Slow and inefficient database queries bring down the whole smooth app experience with them as they result in increased latency. Therefore, add indexes for frequently queried fields or rewrite nested queries.
-
Use CDNs (Content Delivery Networks).
CDNs cache content closer to end users, hence reducing the distance packets travel. Instead of every data packet traveling across different continents to reach your original server, a CDN provides cached content from an edge node that is closer by, which means removing hundreds of milliseconds. Popular CNDs include Cloudflare, Akamai, and AWS CloudFront.
-
Set up Global servers.
In cases where you are serving global or international audiences or clients, set up global servers to reduce latency due to geographical distance. This is because when you have your servers in one region, even a fast one, it means long-distance travel for users in other regions.
-
Apply caching.
Caching is one of the most effective strategies for reducing or removing latency. Browser caching enables clients to store static content locally, so that they do not have to hit the server every time they want that content. Also, application-level caching enables caching the results of expensive computations and database queries.
Reverse proxy caching involves the use of tools like Nginx to serve repeat responses directly, skipping the app altogether. All these caching strategies help remove or reduce the time taken to get responses. Even if just taking off 60-second TTL, that has a great impact.
How to Troubleshoot Network Latency Issues

In incidents of network latency spikes, engineers work hard to ensure that the problem is solved as fast as possible before users start to complain.
-
Start with basic checks.
Start with the simple tools in the terminal, that is,
pingandtraceroute. These will help in finding where delays are occurring. -
Assess server performance.
Check how your server is functioning, as slow and strained servers at times mimic network issues. This could be the reason why your application is slow.
-
Examine application-level bottlenecks.
At times, a latency spike is due to the application itself; thus, it is advisable to check for slow database queries, how external API calls are working, or heaving processing task that can block other operations and increase response times.
-
Monitor traffic patterns.
Latency main spike during high usage hours or rate limits, or even insufficient autoscaling. It is therefore it is good to check how all these are working as they could be the main cause of the latency issue.
-
Test from multiple locations.
Test response times from different locations or cities using tools like Pingdom or WebPageTest. This helps in knowing the difference between local network problems and wider network issues.
Best Practices for Monitoring and Improving Network Latency

-
Design and build with latency in mind. When building your system or application, design and build it while considering latency. Make assumptions that some parts of the system will be slow and others will be flaky, and design the system to handle all such scenarios accordingly.
-
Always set time-outs. These help avoid long waiting times in case of infinitely slow responses, which are usually inconvenient.
-
Test under adverse network conditions. Before pushing your application to end users, simulate adverse network conditions like high network latency and ensure that your applications work well in such scenarios to avoid inconvenience in case of their occurrence after deployment.
-
Cache strategically. Caching helps reduce latency; therefore, use it well, for example, for static content, utilize client-side caching, and use edge caching with CDNs for globally distributed applications.
Conclusion
In this article, we have explored in depth about network latency, what it is, and its importance. We have also looked at the different types of network latency and the causes of network latency issues. We learnt how to test and measure network latency and why it is important to test it. We also learnt how to check network latency using ping and traceroute, and how network analyzers help in testing network latency.
Other important concepts we looked at include how to reduce network latency, how to troubleshoot network latency issues, and the best industry practices to follow when monitoring and improving network latency.
With this detailed guide, you have acquired the knowledge to enable you to minimize latency issues in your workflows and systems, as well as troubleshoot any latency issues in case any arise.
Related Keploy Blogs
You can continue reading some of our related blogs below.
-
Latency Testing Guide for Faster Apps. This blog explores more about latency testing and how it makes a bigger impact, and why you should care about it.
-
Decoding Network Traffic: Telemetry With Network Activity. This blog explores how network telemetry provides more detailed insights into key metrics, including traffic patterns, latency, and packet loss.
-
Benchmark Testing in Software: The Key to Optimizing Performance. This blog explores the details of Benchmark testing and how to improve software performance.
FAQs
-
What is a good network latency?
Under 50 ms is excellent. 50–100 ms is acceptable. Above 150 ms may cause lagging and inconvenience.
-
Does higher bandwidth reduce latency?
Not necessarily. Bandwidth increases capacity, but latency is about the delay.
-
Why does gaming require low latency?
This is because real-time response is crucial in gaming, thus high latency leads to lag and poor gameplay.
-
Which Wi-Fi has the best latency?
Wi-Fi 7 has the best latency. It operates across the 2.4 GHz, 5 GHz, and 6 GHz frequency bands, allowing data transmission at once.
-
Is high latency good or bad?
High latency means more lagging, therefore it is not good and causes inconvenience.
Leave a Reply