Introduction
In my journey as a software enthusiast, I’ve constantly sought innovative ways to unravel the intricacies of my Go applications. Recently, I stumbled upon a fascinating technology that has significantly transformed the way I observe and analyze Go processes, especially when managing Go processes efficiently in production environments.
In this blog post, We’ll go on a journey of observing Go processes with eBPF. Let’s first get to understand "what is eBPF?"
what is eBPF?
eBPF tracing is a technology that enables user a closer examination of how a kernel is behaving. This permits the attachment of lightweight & low-level programs called eBPF programs to specific events within the kernel. Think of it as setting up unobtrusive "listeners" throughout the system, each reporting valuable information.

There are various ways to write eBPF programs, BCC, bpftrace and a new development called libbpf.
With eBPF programs, users can observe Go process at the kernel level using tracing. Sysadmins, DevOps engineers, SREs, etc find this insightful because it is makes troubleshooting faster. As previously, it used to take days to figure out issues that require this level of visibility with current troubleshooting techniques.
There are two types of tracing available – static (tracepoints, USDT probes) and dynamic (kprobes, uprobes).
How to get started with GO and eBPF?
If this works, you should be able to generate a Go trace from observed behaviour on a Linux machine. e.g. Is there a certain network path that shouldn’t be happening?
It is worth pointing out again that there are other ways to get this information, e.g. instrumentation, core dumps debugging, etc. This is for those who can’t modify the application, but also can’t hinder performance. It’s also useful for maintainers who want to do this without deploying code changes.
Go Lang doesn’t need to support eBPF because it operates differently from languages and systems that benefit from eBPF. Stacks such as NodeJS doesn’t support USDT probes nodejs/node#issue .
Go Lang creates executable files and has a runtime that allows for introspection, in line with its design principles. This native observability simplifies the need for eBPF-like techniques for monitoring and tracing. The way Go Lang is built and integrated with the system gives it enough visibility and control without requiring the additional support of eBPF.
How does Tracing with eBPF work?
This section introduces tracing methods in eBPF and if they can be fit for this purpose. Let’s evaluate the different types of eBPF tracing methods available:
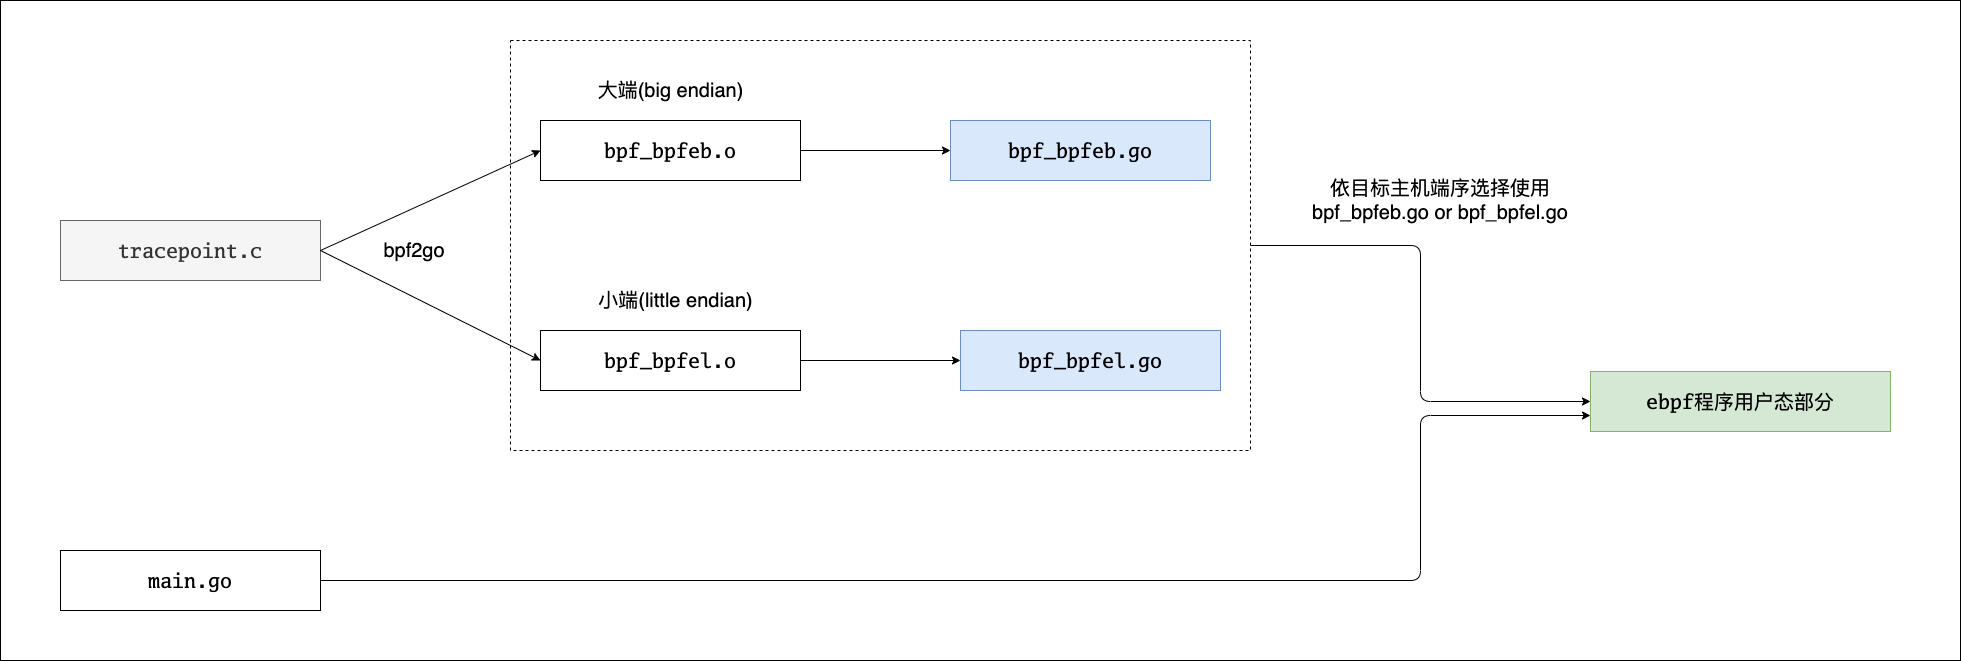
- Tracepoints are eBPF probes attached to predefined kernel events, providing a way to observe fundamental system behaviours. Hence we can use them to trace kernel syscalls such as open(2), write(2), etc. You can learn by example “Go_ebpf_tracepoint“

- USDT Probes (Static) are like tracepoints but instead created by user-space developers for their code.
- Dynamic:- Kprobes allow us to attach probes to arbitrary kernel functions, while Uprobes do the same for user-space functions. A good sample project can be founded by “ebpf_Kprobe” by Cilium.
In Go processes, we can use USDT (User-Level Statically Defined Tracing) probes. These probes help us highlight specific parts of our application code.
This way, we can closely watch how our application runs and how it interacts with the system. This observation helps us understand how the program behaves and its connection to the system. First, we must register a USDT probe in the go code.
if err := unix.Uprobe(nil, "your_probe_name", "your_probe_description");
err != nil {
    fmt.Printf("Error registering probe: %v\n", err)
    return
}
Now that we’ve modified the Go code with USDT probes, we will use eBPF to trace those probes. Here’s an example of how you might write eBPF code to achieve this:
#include <uapi/linux/ptrace.h>

BPF_PERF_OUTPUT(events);

int trace_usdt(struct pt_regs *ctx) {
    char str[80];
    bpf_usdt_readarg(1, ctx, &str, sizeof(str));

    events.perf_submit(ctx, &str, sizeof(str));

    return 0;
}
In this eBPF program:
BPF_PERF_OUTPUT(events);declares an output event namedeventsthat will be used to send data to user space.int trace_usdt(struct pt_regs *ctx)is the probe handler function. It reads the argument from the USDT probe and submits it to theeventsoutput.bpf_usdt_readarg(1, ctx, &str, sizeof(str));reads the first argument of the USDT probe and stores it in thestrvariable.events.perf_submit(ctx, &str, sizeof(str));submits the data to the user space for further processing.
Gathering Insights and Optimizing
By attaching probes into a Go application, we can collect crucial runtime information. This includes details like function calls, system calls, and events related to memory allocation. The data collected from probes are extremely helpful, such as we can track metrics like memory allocation patterns, and network interactions.
And this only helps us optimize performance as well as in identifying bottlenecks and unexpected behaviours.
Conclusion:
After exploring Go processes with eBPF, I can’t help but be amazed at the transformative power it holds. This journey has highlighted the significance of a deeper understanding of application behaviour, one that eBPF facilitates with grace. eBPF is a tool that stands at the crossroads of innovation and performance, to provide better metrics for optimization strategy.
eBPF simplifies code execution, untangles bottlenecks, and improves application efficiency, making it a great tool for software enthusiasts. To improve Go applications, it is important to embrace technologies like eBPF in software development.


Leave a Reply