APIs are an integral part of contemporary software systems. They not only remain central to the seamless operation of software in mobile app development, but also in integrations and microservices. A failure of an API, a slowdown of an API, or unpredictable behavior can have serious issues—this is where API monitoring is useful.
Though there are many developers who know about API monitoring, most of them have the slightest idea about how it works behind the scenes. In this blog, we will discuss how API monitoring works and how it helps in maintaining optimal performance, uptime, and reliability.
What Is API Monitoring?
API monitoring is the process of tracking the performance and business metrics of an API’s endpoints to ensure the APIs are working optimally, delivering the expected performance, and providing the expected results. API monitoring involves issuing test requests to the APIs, monitoring the response time, error detection, and alerting on failure.
API monitoring is more than just the mere act of ‘pinging an endpoint." Let us set aside the "ping an endpoint" bias and delve into the inherent and much more intricate processes.
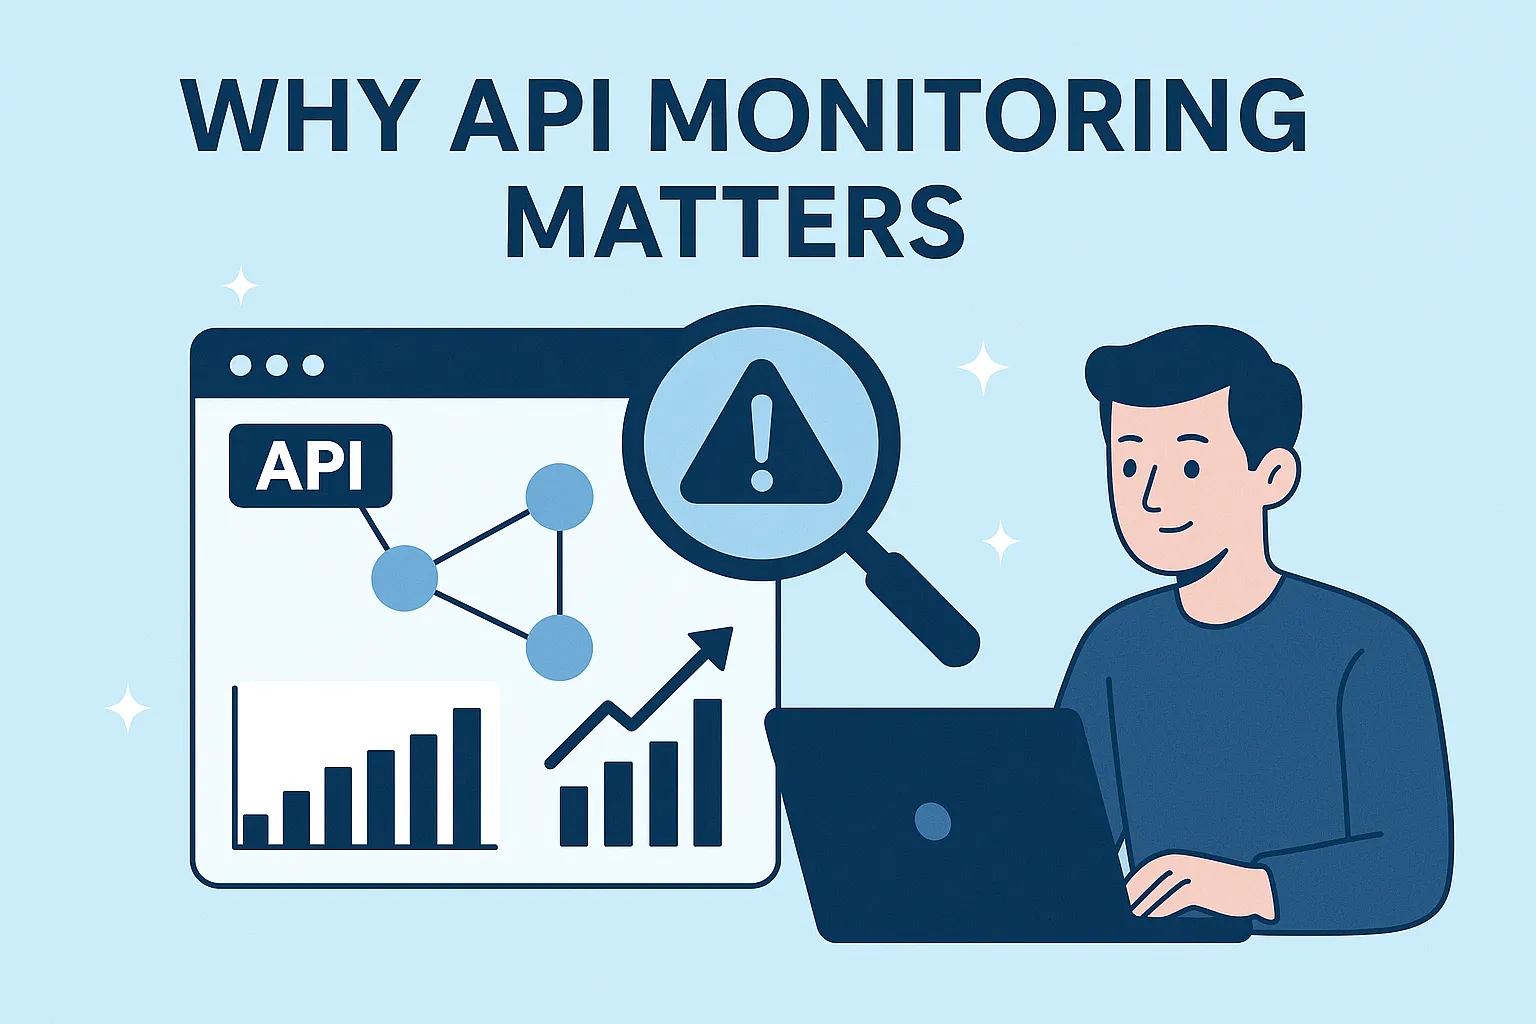
Why API Monitoring Matters?
Take the case of an active ride-sharing app user. You have set your location and nothing happens. In reality, the API that connects you to the nearby drivers might either be nonresponsive or take an inordinate delay. Either case, it quite badly impairs user experience and business gain.
Good API monitoring guarantees that:
-
API health is monitored all the time
-
Downtime is caught early
-
Developers are notified before the customers are affected
-
Performance is tuned in the long term
In the absence of adequate monitoring, companies are operating blindly in regard to the reliability of their applications.
In-Depth Overview: The Functioning of API Monitoring
Now, let’s explore the inner workings. A modern API monitoring system typically has five core components working together:
1. Synthetic Monitoring Agents
These are automated systems that mimic real-world API calls. They send requests at regular intervals—sometimes from multiple geographic locations—to simulate user traffic.
For example, an agent may:
-
Make a GET request on the /status endpoint every minute.
-
Measure the time to respond.
-
Verify that the expected response body, in addition to the HTTP status code, is actually the one received.
This test traffic is the basis of api uptime monitoring and api performance monitoring.
2. Validation Engines
It is not merely receiving a response, but also the quality of it. Monitoring software tests responses for their content:
-
Is the JSON format valid?
-
Are there key fields (such as status: "OK")?
-
Is the data new or old?
This allows api health monitoring to extend beyond shallow checks.
3. Latency and Performance Monitoring
Each API call being monitored is timed. This information is inspected to reveal the following details:
-
The Average response time
-
The Peak latency windows
-
Performance degradation over time (if any)
This is the heart of api performance monitoring. These common trends may indicate architectural bottlenecks or infrastructure problems before they become major issues in the future.
4. Alerting and Incident Management
Whenever an API is slowing or failing beyond a threshold, the monitoring system sends out alerts. Alerts may be delivered to:
-
Email
-
Slack channels
-
Incident management software such as PagerDuty or Opsgenie
Advanced systems can even automatically invoke rollback scripts or close down the faulty endpoints. This is related to proactive api uptime monitoring, avoiding user-visible outages.
5. Data Aggregation and Dashboards
All data gathered is kept in time-series databases and graphed on dashboards. Teams can track:
-
Uptime% over time
-
Error rates by endpoint
-
Geographic response time variations
This not only provides a real-time overview of api health, but also assists in post-incident reviews.
Active vs Passive API Monitoring
Most systems employ both:
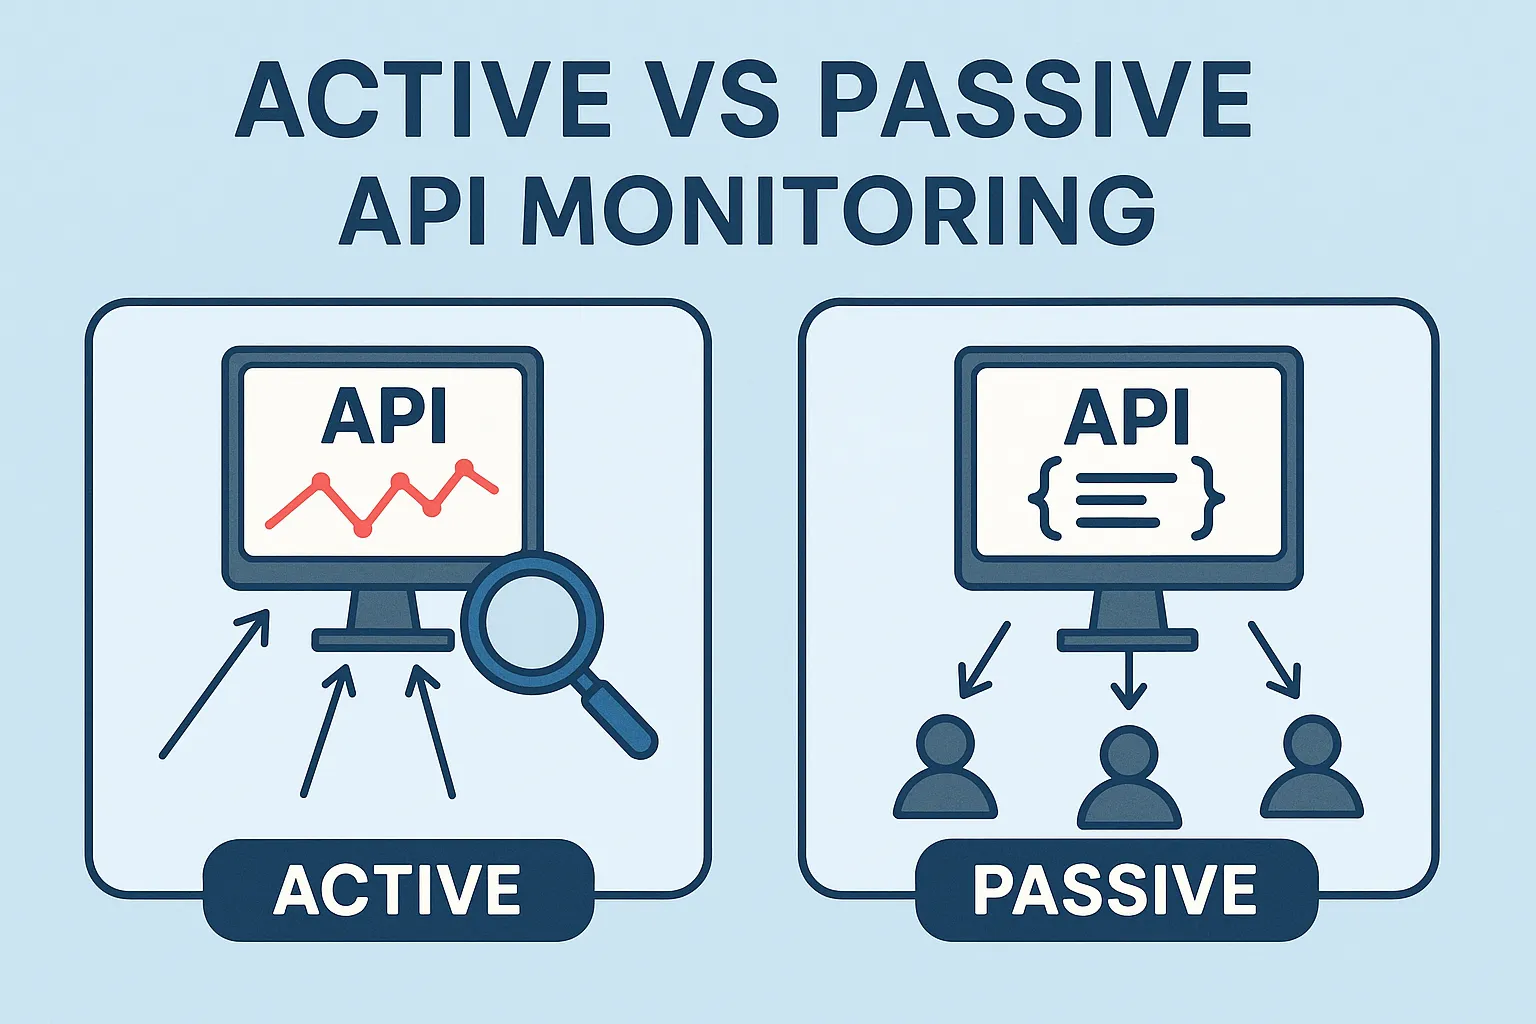
Active monitoring (synthetic checks)
Passive monitoring (logging real user traffic)
Having both together gives complete observability: synthetic monitors pick up on problems early, and passive logs show actual user effects.
Use Case Example: Monitoring a Payment API
Let’s go through an example in real life:
Step 1: A synthetic agent makes a test POST request to your /process-payment endpoint every minute.
Step 2: The validation engine verifies that the response contains a confirmation number.
Step 3: Performance logs indicate a spike in latency from 300ms to 1.2s.
Step 4: An alert is generated and alerted to the on-call engineer
Step 5: The problem is traced back to a downstream database timeout.
Step 6: The engineers repair it before actual users even start to report payment failures.
This is the magic of behind-the-scenes api monitoring in action.
API Health Monitoring vs Uptime Monitoring
Let’s debunk a common myth around this:
API uptime monitoring validates whether the endpoint is up (i.e., responds with 200 OK)
While API health monitoring takes it further, checking for response quality and correctness
Both are important. You could have 100% uptime yet deliver broken or slow responses that damage user experience.
Best Practices for Good API Monitoring
To get the most out of your monitoring configuration, try these approaches:

✅ Monitor All Key Endpoints
Don’t just watch /health; watch all high-impact APIs such as authentication, payments, and data syncs.
✅ Smart Thresholds
Prevent alert fatigue. Don’t alert on a one-off slow request—alert on repeated performance degradation or error rate spikes.
✅ Geographic Coverage
Utilize synthetic agents in different regions to pick up local network problems.
✅ API Dependencies
If your APIs are dependent on third-party services, monitor those as well (such as Stripe, SendGrid, or Twilio).
✅ Set up in CI/CD
Include simple monitoring hooks after deployment to detect regressions early.
Top Tools for API Monitoring
There are numerous tools—both free and commercial—that assist in automating this process. Some worth noting:
Keploy – Open-source API testing + monitoring through auto-generated mocks
Postman Monitors – Excellent for lightweight API checks
Alerty – Real-time uptime and error alerting
Splunk – For API monitoring at scale
LoadView – For stress testing and uptime verification
Each one of these tools have various strengths based on your scale and requirements.
Conclusion
APIs are only as good as their monitors. Active management of an API is a whole lot more than simply managing downtimes; it involves maintaining the health of the API as well as proactively predicting slow, degrading, failing, or any degradation in performance weeks, months, or even years before users interact with the API. Knowing the finer, less-researched aspects of the monitoring procedures goes a long way in helping teams strengthen their protection mechanisms, control their SLA, and improve confidence in frictionless system interactions.
FAQs
1. What distinguishes API monitoring from monitoring the entire app?
Ans: API monitoring concentrates on the very endpoints your app requires, like whether your login API is functioning properly or how fast a payment gateway returns. The old application monitoring, by contrast, examines infrastructure, such as CPU, memory, or server availability. Both are significant, yet API monitoring allows you to observe how your app communicates with other apps rather than how it performs.
2. How frequently should you monitor API endpoints?
It’s not uncommon to monitor critical APIs (such as login, checkout, or third-party integrations) every 30 seconds to 1 minute for the majority of production environments. You can monitor lower-priority endpoints every few minutes. The idea is to catch issues early on without flooding your system or your alerting pipelines.
3. Can monitoring APIs prepare me for future growth?
Of course. Eventually, monitoring tools accumulate data about how users use the system, including which endpoints are most heavily trafficked and when traffic surges occur. That allows you to make better decisions on how to expand your infrastructure, where to allocate your resources, or even which APIs need to be tuned up before they bring things down.

Leave a Reply