In the age of data, numbers have to be meaningful in a bid to inform intelligent choices. Regression analysis is a great statistical tool utilized to reveal the interconnectedness among variables. From forecasting sales to having knowledge of medical outcomes, it converts raw data into practical knowledge.
It assist businesses and researchers in accurately estimating, identifying inefficiencies, and benefiting from improved outcomes. If you are new to analytics or just refining your models, regression is something you must know. It describes how regression is conducted, categories, assumptions, and how model precision can be improved.
What is Regression Analysis?
Regression analysis is a statistical technique for explaining the relationship of a dependent variable with two or more independent variables. In simpler words, it provides answers to questions like: "How is one factor being changed by another?"
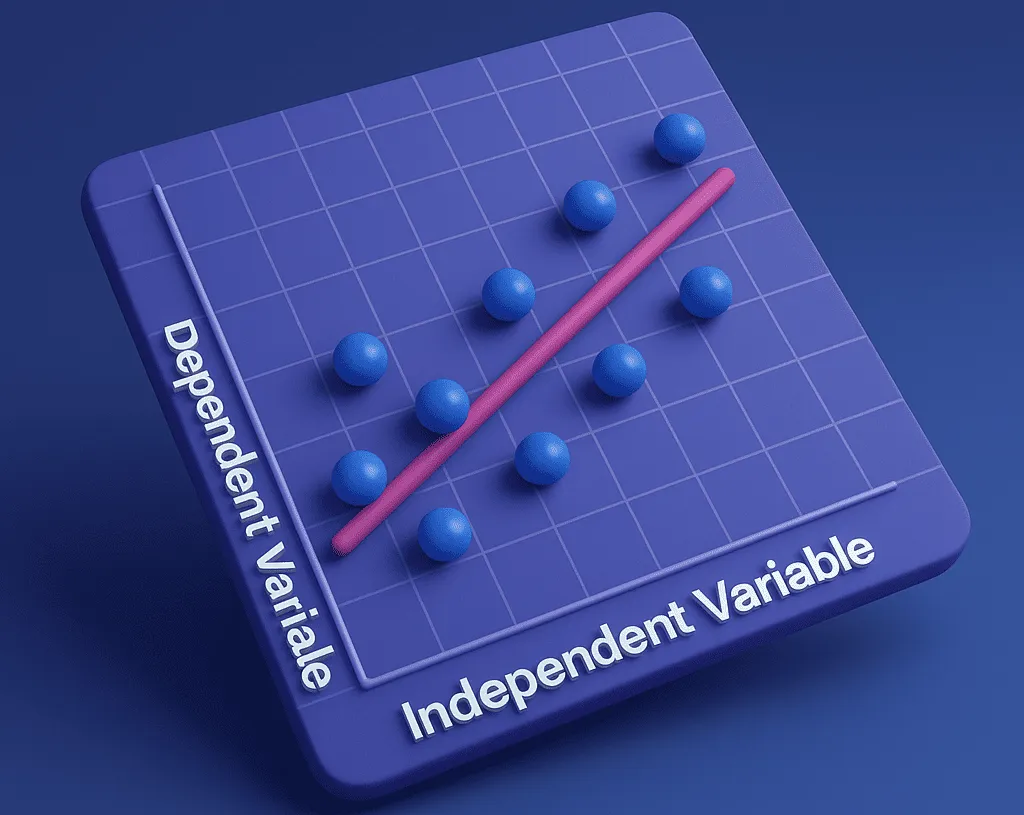
Assume that you wanted to predict the outcome of a student’s exam based on the number of hours that he or she has worked. Regression not only lets you do this, but it also tells you how much the two are associated. It is like drawing a best-fit line through your data in an effort to find patterns and make some smart guesses about things that will occur in the future.
How Does Regression Analysis Work?
In fact, regression analysis just finds the mathematical equation that most accurately describes how the variables are related. Think of trying to plot the line which goes most directly through a group of data points in such a way as to most accurately summarize the overall trend. That "line" is your model.
The process starts by selecting your dependent variable (what you’re trying to predict) and one or more independent variables (the inputs that may influence the outcome). The model then analyzes past data to find the best-fit line or curve that minimizes the gap between actual and predicted values. This difference is called the residual or error.
Once the model is trained, it may be used to make predictions or see how different things influence in terms of results.
Actual Example: Regression Used by a SaaS Company
Suppose a SaaS business sells project management software. Its advertising team would like to understand how ad spend, content published, and engagement on social media use affects sign-ups for its software monthly.
They apply multiple linear regression to this:
1. Dependent variables: Sign-ups each month
2. Independent variables: Ad spend, blog posts published, and Instagram engagement score
Regression analysis tells them that advertising spending has the largest impact, and then comes content development. Ironically, social media interaction wasn’t so predictive.Equipped with this knowledge, the team reallocates resource investment – reducing effort in wasteful social media and increasing effort in paid ad and blog posts – and eventually more effective growth.
Types of Regression – Quick Look
Okay, so regression ain’t just one thing. Depends on your data and what you wanna figure out. Different types fit different stuff. Here’s a quick rundown, nothing fancy.
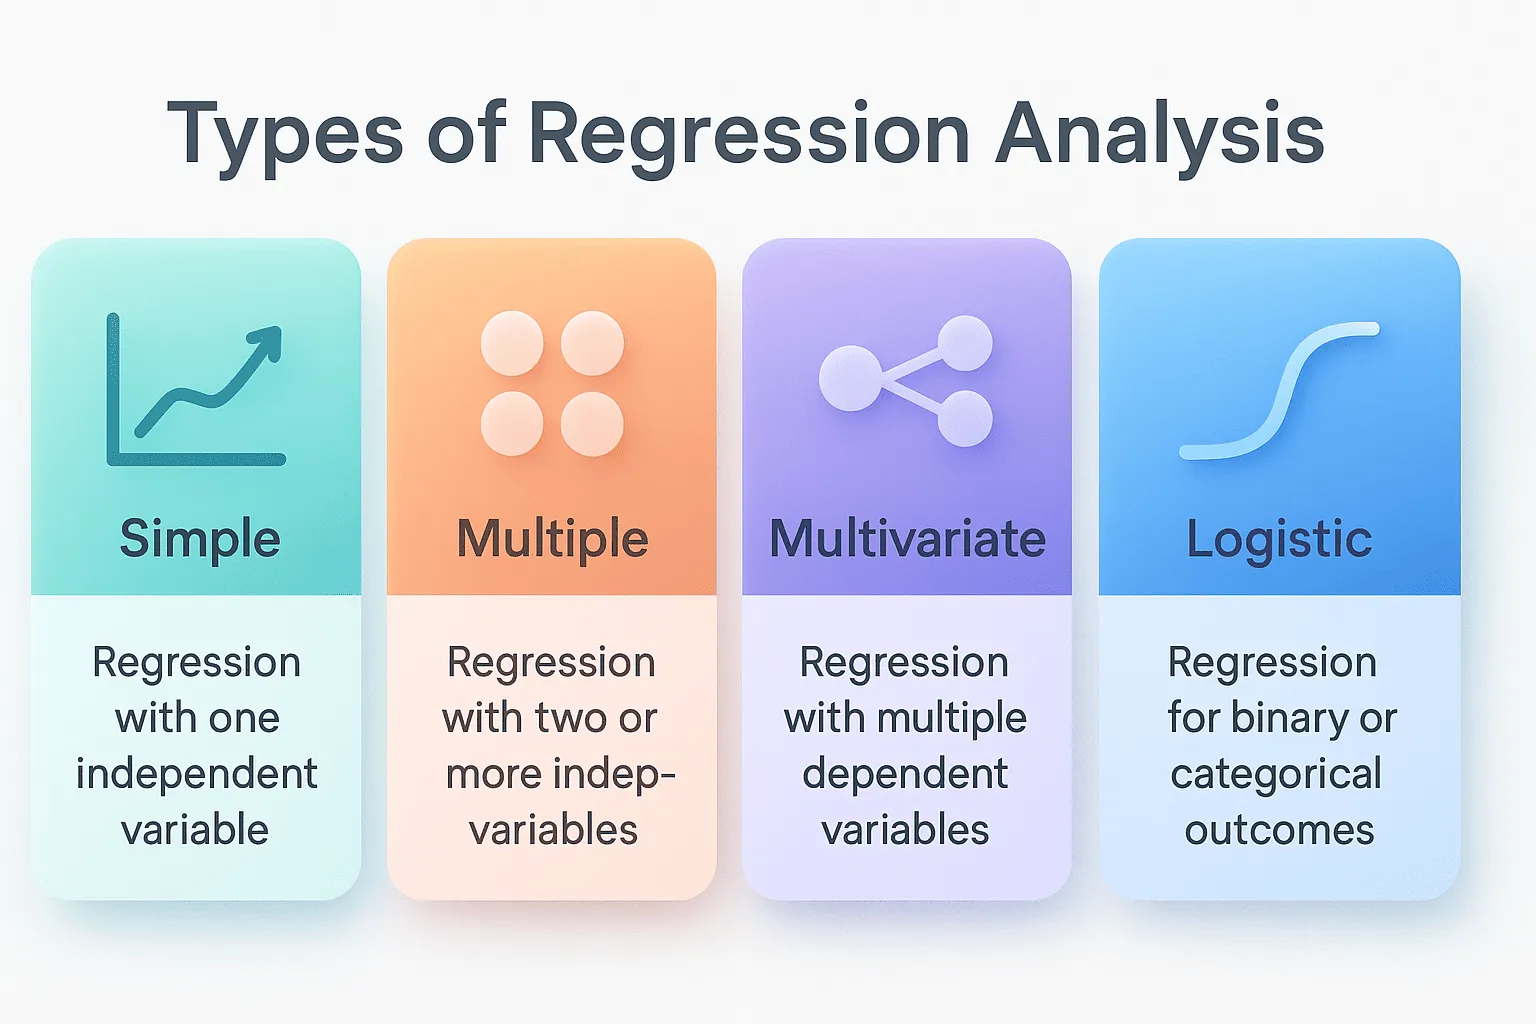
1. Simple Linear Regression
This one’s easy. One thing you check to guess one other thing. Think of it like a straight line – if one goes up, the other usually does too.
Like, say your onboarding team wants to see if sending more emails means users stick around after a month. Simple linear regression tells you if more emails = more users staying.
2. Multiple Linear Regression
Now, here’s when you got more than one thing affecting the result. You mix ’em all and see what works.
Example: Marketing wants to guess revenue from web hits, ads, and email pushes. Multiple regression shows what combo matters most so they spend smarter.
3. Multivariate Linear Regression
Trickier one. You’re guessing more than one thing at once based on some data. Useful if the things you guess kinda depend on each other.
For example, product manager wants to guess churn and session length at the same time using usage, support calls, and customer tier. Multivariate regression helps see how those all link.
4. Logistic Regression
This one’s different – it’s not about numbers going up and down. It’s yes/no, will something happen or nah.
Like, growth team wants to find out if a trial user will pay or not. They look at feature use, logins, support tickets. Logistic regression spits out chances so they can focus on likely buyers.
What Is the Purpose of Regression?
Essentially, the use of regression analysis allows you to examine how all the jigsaw pieces are assembled. It is not math in itself – it’s an exploration tool. It allows you to examine the effect of different variables on the end result so that you can forecast future patterns, make choices, and maximize performance.
This is the easy explanation of the main uses of regression:
1. Forecasting Future Outcomes
Prediction is one of the most widespread applications of regression. Regression models can be utilized to predict future values using historical data by analyzing historical data. For example, they can predict user growth or sales next month based on trends.
Example: A SaaS company is forecasting next month’s new users based on how much they are using referral programs, how much they are spending on ads, and traffic to their blog.
2. Determine Which Variables Have the Largest Influence on Performance
Regression doesn’t inform you simply what will happen – regression informs you why. It shows you which of your variables affect your result most, and therefore you can focus on those accordingly.
Example: A product team discovers frequency of feature use and login rate influence churn more than the degree of price – informing them what to focus on building in product.
3. Determine How Strong Those Ties Are
Regression provides you with quantifiable insights. It doesn’t merely inform you that something is working, but by how much. You can discover, for example, that for each ₹1,000 of promotion, you acquire 50 new users.
This enables marketing and sales teams to plan and set more realistic expectations better.
4. Identify Inefficiencies or Deteriorating Links
By finding under-performing measurements or outliers, regression can inform you where your plan is failing. You can correct things early.
Example: A regression test may reveal to you that high volume of support tickets is linked with decreased trial-to-paid conversion and that you must improve onboarding or usability.
5. Support Decision-Making with Evidence
Instead of making decisions based on intuition or educated guesses, regression allows teams to make decisions based on facts. From pricing optimization to A/B testing a new feature, to budgeting, regression has you feeling sure about your decision.
Which is to say, SaaS leaders can make more strategic decisions with less risk and more ROI.
Why Linear Regression Is Important?
Linear regression can be simple relative to other machine learning algorithms that are so much more complicated, but it is precisely that which makes it work – and an incredibly valuable tool.
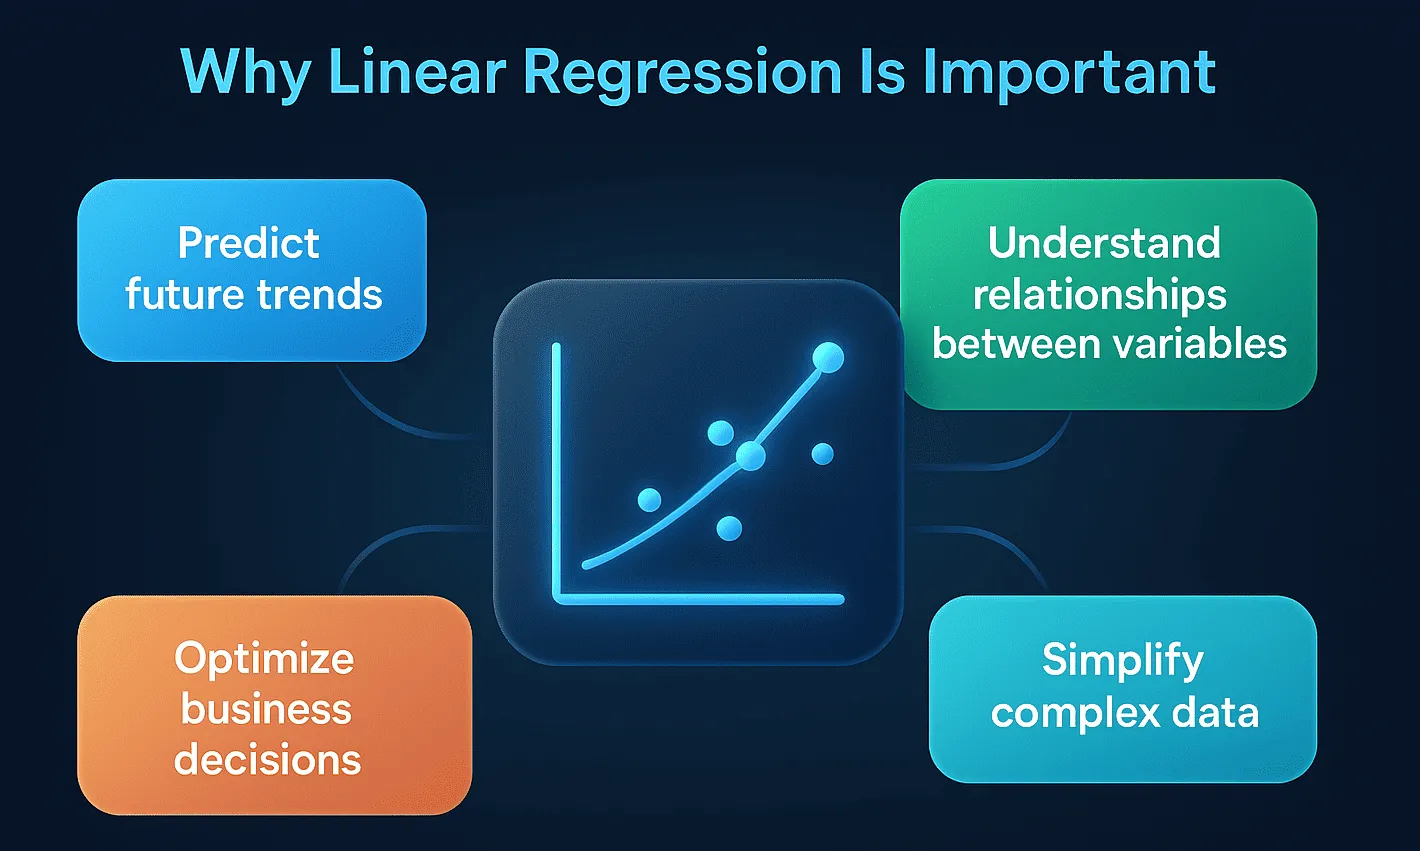
It’s generally first model data analysts, product teams, business decision-makers, and data analysts default model because it’s simple to understand, unambiguous, and fast to provide actionable feedback. Linear regression is good at weeding out basic trends but not highly nonlinear relationships, even though.
Here’s why it’s a classic in data analysis:
-
Simple to Understand and Explain:- Linear regression derives a simple equation
y = mx + b(output = slope × input + intercept).It is actually easy to explain to data science-unequal stakeholders. Marketers to C-suite executives can understand what’s behind the quality. -
Fast to Build, Fast to Run:- Light on computation, linear regression is simpler than advanced models. It can be trained without much effort even with huge data. This makes it perfect for quick experimentation, real-time dashboards, or starting modeling when speed is the most critical factor.
-
Perfect for Discovering Trends:- Linear regression assists you in determining direction relationships – i.e., does an increase in the number of email campaigns result in signups? Yes, how so?
It gives you a solid foundation on how variables will interact with one another over time. -
Ideal Starting Point for Sophisticated Models:- You’re either going to develop sophisticated machine learning systems or not, but linear regression is where you start. It aids in testing assumptions, feature reduction, and setting a baseline in no time.
Mind-blown fact: Linear regression is still what the vast majority of top-performing prediction models are built upon under the hood – especially when speed, simplicity, and interpretability are most important.
API-Based Regression Testing using Keploy
Keployhelps with stopped development testing (learn more in our Regression Testing: An Introductory Guide) by recording spontaneously a real user API call and creating trial instances from the ones. You can use Keploy to play back the aforementioned record API exchanges instead of the updated application when you make changes to your application identical to the release of a new version. Keploy will then compare the current reaction to the previous capture individuals to determine whether any unintended changes have otherwise stalled the development.
Key ways Keploy supports regression testing:

-
It captures and replays real API traffic, ensuring your tests reflect actual user scenarios.
-
Keploy involuntarily mock dependence, so you wear’thymine need a complex trial environment for the arrested development phase.
-
With self-healing tests, Keploy can auto-update minor changes in API responses, reducing maintenance overhead.
-
The flaky test detection feature validates your test results over multiple runs to ensure reliability.
-
Keploy generates a detailed report focusing on each difference between the expected and the actual API response, which makes it simple to detect stalled development.
The present technique improves test coverage, reduces manual effort, and ensures that the recent modifications do not disrupt the current functionality, thereby facilitating the fast and excessively reliable execution of the test.
How to Make Good Predictions with Regression
Regression can help you predict stuff, but only if you do it right. If your model’s off, you’ll waste a lot of time, effort, and resources chasing the wrong answers.
So how do you make sure your regression model actually works? It mostly depends on how well you clean your data, pick the right features, and test your model – all of that matters a lot. Here’s a quick list of what you should do to get decent accuracy:
1. Clean Up Your Data
– Bad data messes everything up. Make sure to:
– Fix missing values or gaps
– Deal with outliers (don’t just ignore them)
– Correct mistakes like typos or duplicated entries
– Even one bad column can ruin your whole model.
2. Pick the Right Features
Not all data is useful. If you throw too many random variables in, your model gets confused and overfits. Use what you know about your problem, get experts to review, or try tools that help pick the most useful variables.
3. Normalize Your Data When Needed
If some features are on totally different scales – like one in dollars and another in thousands – normalize them so the model treats everything fairly. This is especially important when you have multiple features.
4. Check Your Model’s Assumptions
– Good regression models rely on some assumptions, like:
– The relationship should be roughly linear
– No strong correlations between your features
– Constant variance of errors (homoscedasticity)
– Residuals should be normally distributed
Make sure to look at diagnostic plots and run tests to see if these hold.
5. Split Your Data
Don’t just use all your data to train the model. You gotta keep some aside to test it later – that way, you can see if your model actually works on stuff it hasn’t seen before. Sometimes people also keep a third set called validation to fine-tune things. Without splitting, your model might just memorize everything instead of learning patterns
6. Use Regularization When Needed
If your model second kills it on train data but wholly fails on new material, it second is probably overfitting. It is basically memorizing rather than learning. In order to remedy this, you can use the approaches admiring Lasso and Ridge – their understanding of how to keep the model from becoming too braindead, and therefore, their ability to process recent data has improved.
Assumptions in Regression Analysis
Regression analysis appears simple at first glance, but under the hood it’s a fairly complicated beast because it builds on a number of key assumptions. If these assumptions are violated, the predictions you make with the model can be… Untrustworthy (i.e., the predictions are unreliable) Or it can be… Misleading (in other words, you could make bad decisions with the model’s predictions). Knowing these assumptions can help you determine whether your regression results are valid – and, if not, what you can do about it.
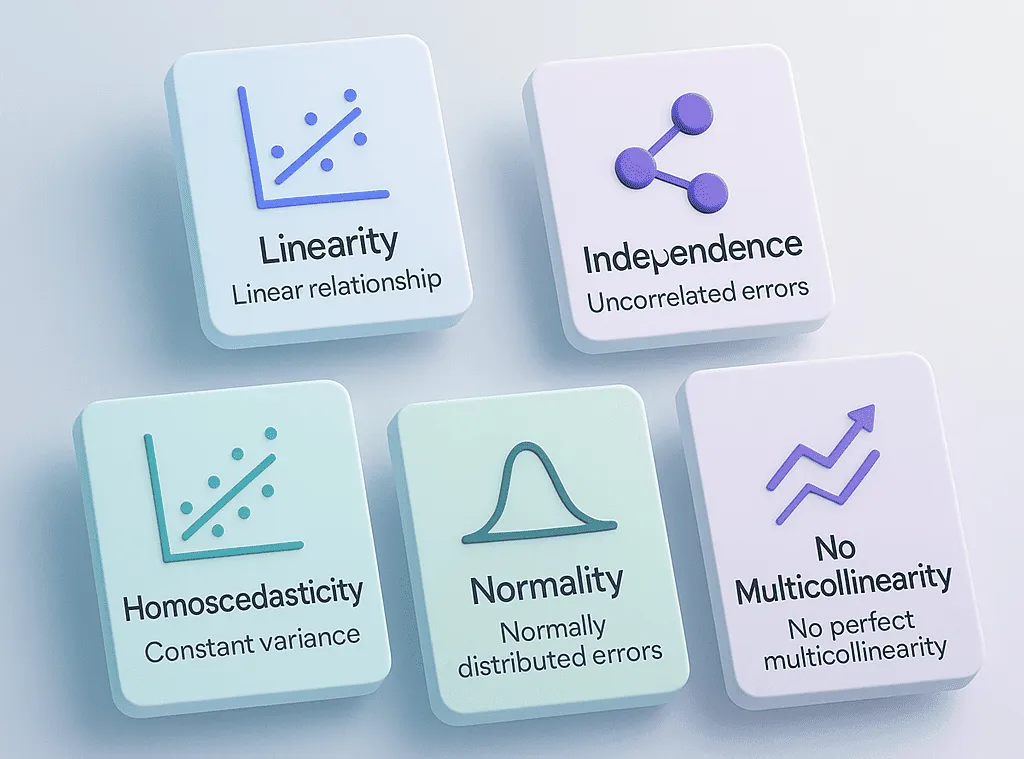
Here we will discuss the fundamental assumptions which a data-scientist/analyst should test for any regression models, they are:
1. Linearity
This implies that the independent variables (input) and the dependent variable (output) have a linear relationship. That is, as X changes, Y can change as well.
Example: For a SaaS product, if increasing the quantity of logins results in a stable growth of the retention rate, you are facing linearity.
2. Independence of Errors
The residuals (differences between the observed and predicted values) should not have a linear trend. This is of particular concern when analyzing time series where values may comove over time.
Why it matters: If residuals are dependent, it suggests patterns in the data that the model is not accounting for, which can bias the results.
3.Homoscedasticity (Constant Variance of Errors)
The variability of the residuals needs to be constant at all levels of the independent variables. When this isn’t true, it’s known as heteroscedasticity and it can bias the confidence intervals.
Example: If you have a model that is predicting model customer churn and it has more error for high spending customers than low spending customers then it violates the assumption of homoscedasticity.
4.Normality of Residuals
The residuals should be normally distributed, if you’re thinking of doing hypothesis testing with the regression model (e.g., confidence intervals, p-values).
Tip: You might do so with a Q-Q plot or a histogram of residuals. If it’s not bell-shaped, it may warn of skewed data or outliers.
5. No Multicollinearity
Multicollinearity would occur when there are two or more independent variables with high correlations. This can make it challenging to understand what any given variable is truly adding to your model.
Fix: Employ methods such as Variance Inflation Factor (VIF) analysis to detect and mitigate multicollinearity.
How to Know If Regression Assumptions Are Violated
Wrapping your head around the assumptions of a regression is one thing, but actually knowing how to tell when those assumptions don’t hold in your data is quite another! The good news is, however, that there are basic and visual methods for you to spot offences before they screw up your analysis.
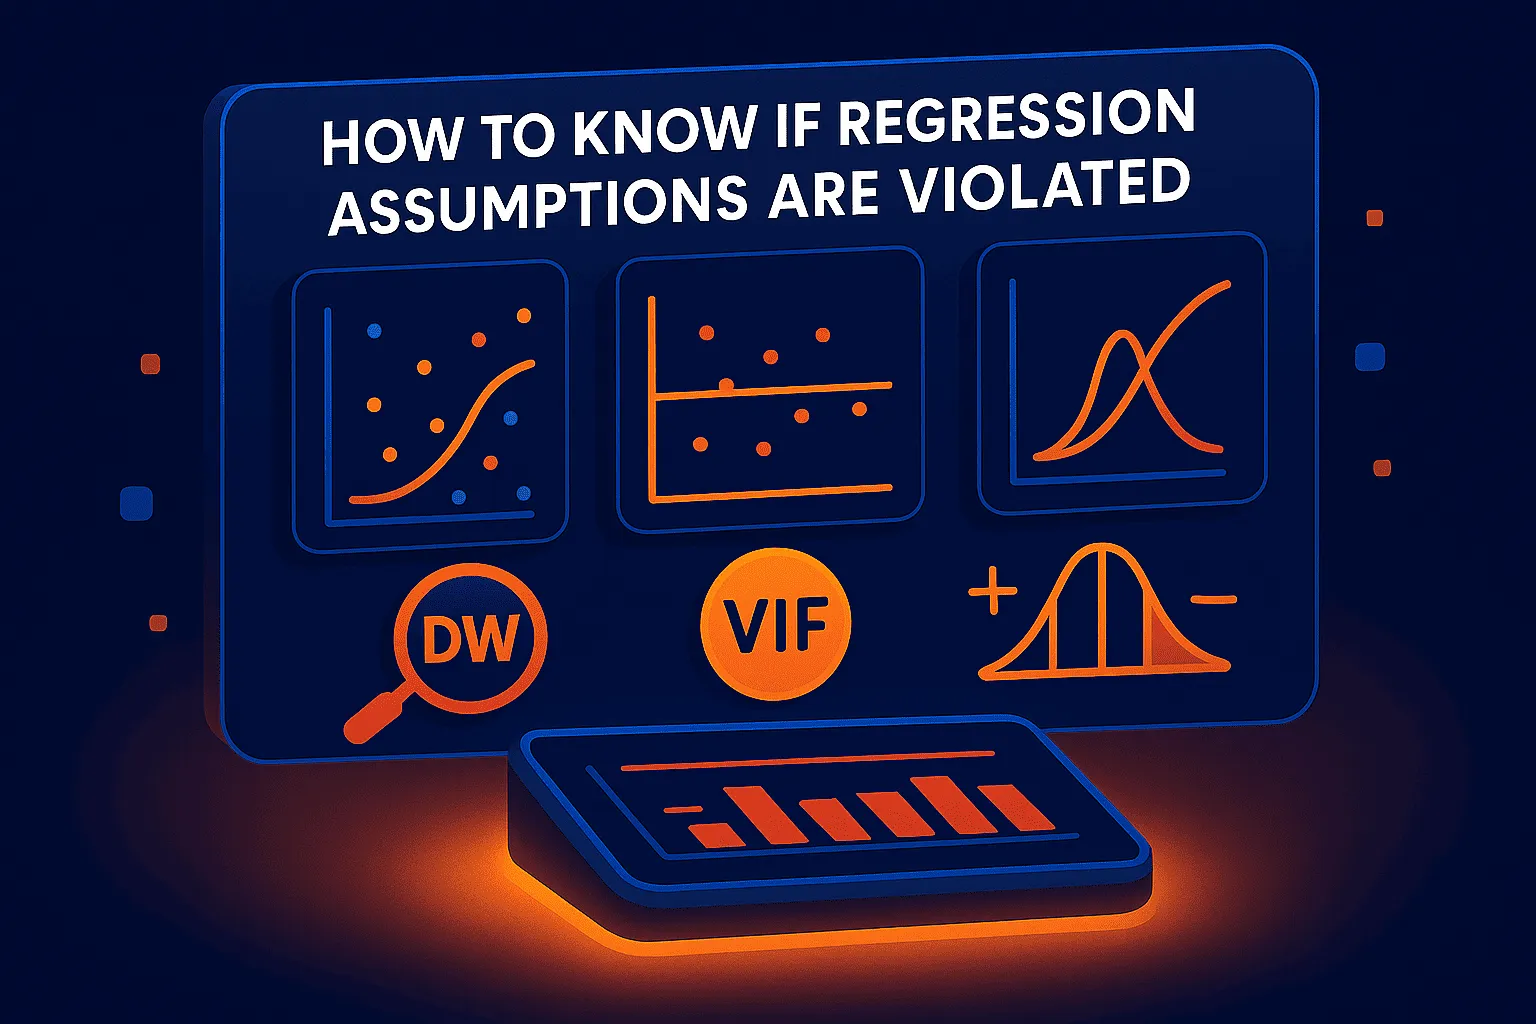
Here is how to test each one of the major assumptions of EDA using common and practical tools/techniques.
1.Test Linearity with Scatter Plots
I’m guessing you should graph your dependent against each independent. If no relationship seems to exist (meaning no curve for the dots) then you’re good to go. If you notice any curves, or clusters, it may suggest that a non-linear relationship is lurking within your data.
Example : In churn likelihood modeling, draw “login frequency” vs “churn rate.” If the relationship is not a straight one, you might need a different model or transformation.
2.Testing for Constant Variance with Residual Plots
Homoscedasticity refers to the constant variance among the residuals at every level of the predictions. To verify this behavior, one should produce a residual vs. the fitted value plot. If they fan out (spread further apart or close), this is a sign of heteroscedasticity and your model might be biased.
Pro tip: If necessary, use log transformations or weighted regression to address this.
3.Test for Independence using the Durbin-Watson Statistic
In time-series data or the sequential data, residuals should not show any correlation. The Durbin-Watson statistic is a test for autocorrelation. A sound GWiS should produce a value of around 2 (indicating that the residuals appear to be independent); a value less than 1.5 or greater than 2.5 suggests possible problems.
Example: If you’re forecasting daily signups and your errors have a trend to them, it may be because your model is not accounting for some seasonality.
4. Check Multicollinearity with VIF (Variance Inflation Factor)
Multicollinearity is where two or more independent variables are highly correlated, and it becomes impossible to identify which variable is responsible for the output. Utilize VIF scores – a VIF of more than 5 (or 10, depending on the circumstances) usually signifies a problem.
Solution: Drop or combine correlated variables, or implement dimensionality reduction techniques such as PCA.
5. Test Normality using Q-Q Plots or the Shapiro-Wilk Test
Residuals should be normally distributed, particularly if you will build confidence intervals or hypothesis tests. Residual distribution can be compared against a theoretical normal distribution using a Q-Q plot. Non-normality exists if the points lie far from the diagonal line.
Or, you can also utilize the Shapiro-Wilk test, where it provides you with a p-value that tells you if residuals significantly vary from normality.
What Is the Purpose of Regression?
In essence, regression is where we learn about variable relationships and can predict things. Whether you’re predicting sales, customer churn or app time spent, regression explains how various factors influence your result.
It’s not only prediction; it’s insights. Regression informs you about what actually causes the difference. If a SaaS business finds that support requests and time to onboard users are good predictors of customer churn, with this, you can make better business decisions.
In brief, regression provides you with two advantages:
-
Explanation: Understanding what variables cause the outcome.
-
Prediction: Measuring future results from current data.
Recommended Blogs
Regression Testing: An Introductory Guide
Learn the fundamentals of regression testing and how it assures new code changes will not add bugs to live functionality. Perfect for developers and QA teams interested in stable, dependable releases.
Unit Testing vs Regression Testing: A Complete Guide
Learn the most crucial distinctions between testing individual functions and retesting following code changes.
Smoke Testing vs Regression Testing: What You Need To Know
Learn the differences between quick health checks (smoke tests) and detailed rechecks (regression tests) and when to use them.
Regression Testing Tools Rankings 2025
Find the top regression testing software of 2025 with feature comparisons and best recommendations for each team size.
Conclusion
Look, regression isn’t just math and numbers – it’s a tool that helps you see how stuff in your data connects and what really moves the needle. Whether you wanna guess future revenue, understand customer habits, or get better at marketing, regression’s your friend. If you’re in SaaS, running campaigns, or watching churn, knowing regression can seriously give you an edge. Just don’t forget to check your assumptions, tweak your models, and keep at it. The more you practice, the more your data will actually help you.
FAQs
-
Why is regression analysis significant?
Regression helps you understand how things are related to one another – e.g., how ad spend relates to sales – and enables you to make better, data-informed decisions.
-
How does linear regression differ from logistic regression?
Linear regression is great if you’re predicting numeric values (like revenue), while logistic regression kicks in if the outcome is a yes/no situation (like whether a user subscribes or not).
-
How do I know my model is actually working well?
You can test it using things like R-squared or percentages of error – and simple plots can show you if your forecasts closely follow the real data.
-
Can I have more than one input to regression?
Absolutely. That is what multiple regression is for – so you can place more than one variable into play at the same time for better predictions.
-
Do I need to program to do regression?
Not at all! Programs like Keploy or even Excel make it a piece of cake – you can do regression analysis with only a few clicks.

Leave a Reply