APIs rarely fail loudly.
Most of the time, they break quietly while dashboards stay green. These silent failures are often the hardest to detect and the most damaging for users.
I learned this while dealing with real production traffic. Everything looked normal until users started complaining. Let’s explore more about how this works.
Why API Issues Are Hard to Catch Early
In my early backend work, I trusted basic API monitoring.
If an API returned 200 OK, I assumed things were fine.
But production told a different story.
Users reported:
-
Slow responses
-
Missing or incorrect data
-
Random failures that were hard to reproduce
At the same time, monitoring tools showed:
-
No downtime
-
Acceptable average latency
-
Normal error rates
The problem was not availability.
The problem was visibility.
Most failures were happening inside the request flow, not at the edges. That’s when I understood why API observability exists.
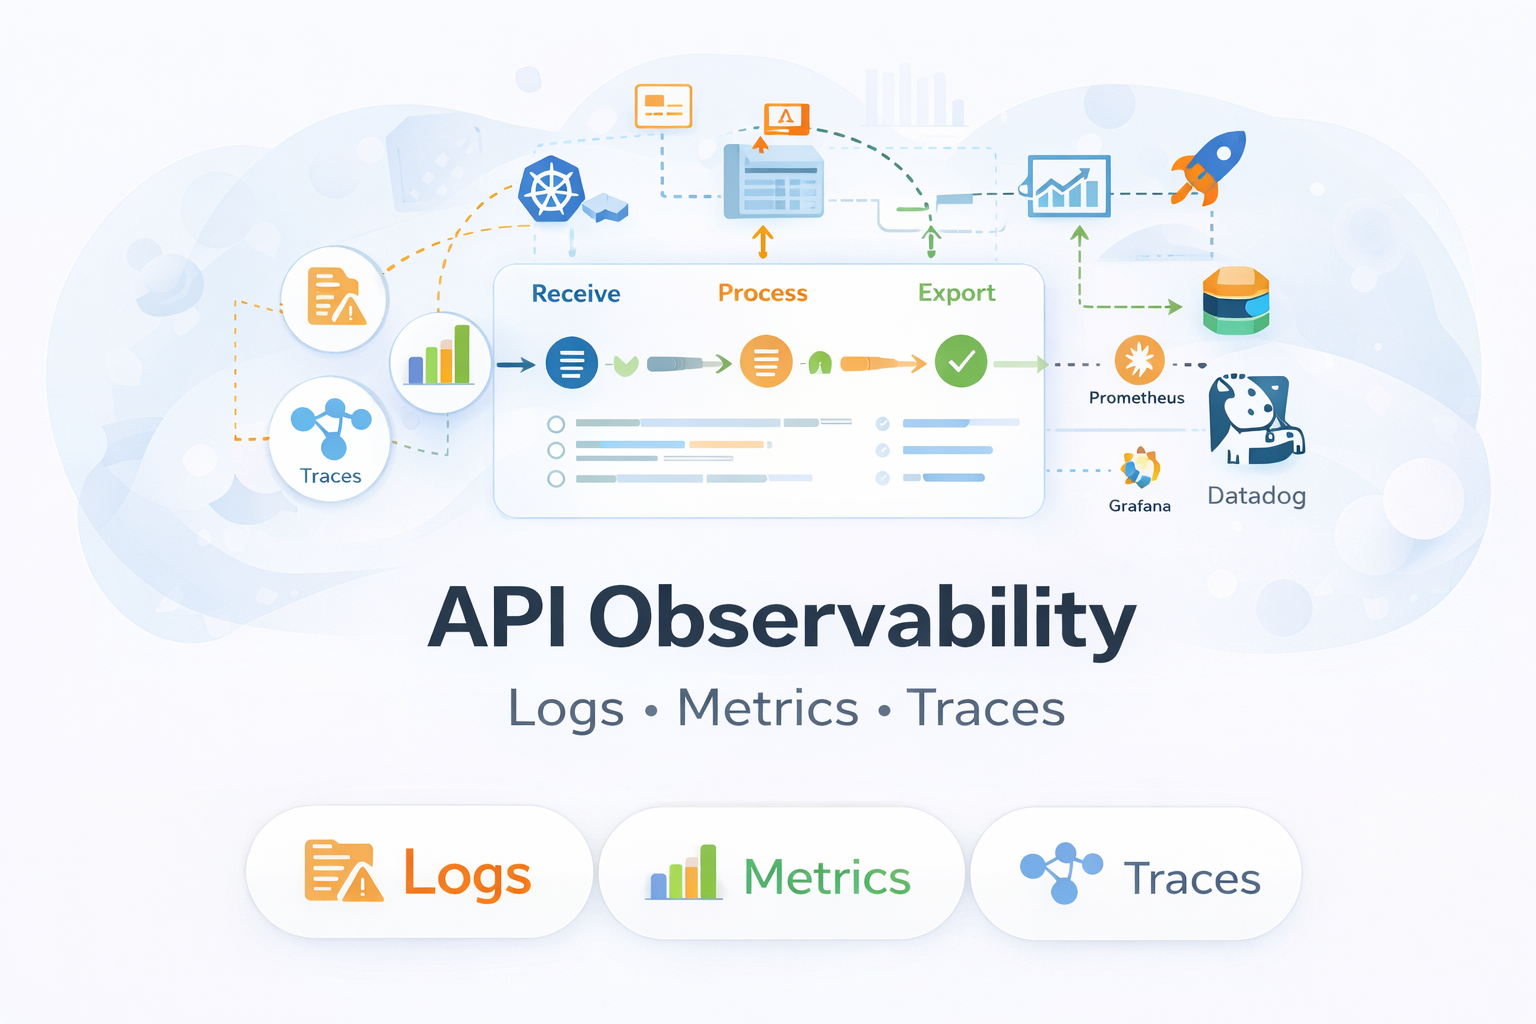
What Is API Observability?
API observability is the ability to understand how APIs behave in real production environments by analyzing logs, metrics, and distributed traces together.
It helps me look beyond surface-level signals like uptime or status codes and focus on actual request behavior under real traffic.
With proper API observability, I can see:
-
How individual API requests move through different services
-
Where latency increases during the request lifecycle
-
Why specific users face failures while others don’t
-
Which internal or external dependencies cause slowdowns or errors
Unlike traditional monitoring, API observability connects technical signals with real user impact.
In current systems where APIs power web apps, mobile apps, and microservices, failures are rarely isolated. Observability turns raw API data into meaningful insight, helping teams debug faster, maintain performance, and protect user trust at scale.
API Observability vs API Monitoring
This distinction matters more than most teams realize.
The difference between API monitoring and API observability becomes clearer when viewed side by side.
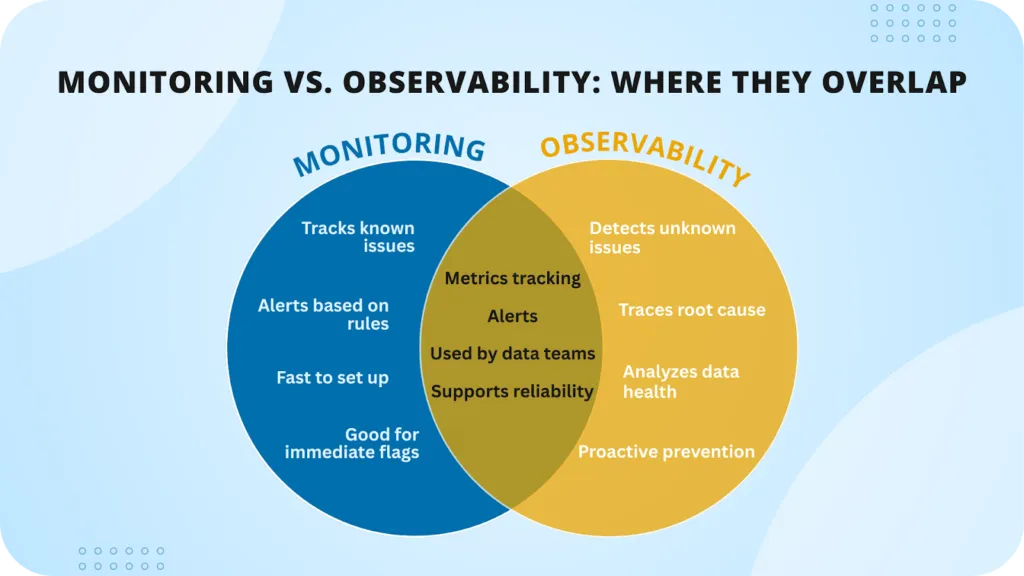
Monitoring focuses on availability, while observability explains behavior and root causes.
API Observability vs API Monitoring (Comparison Table)
| Aspect | API Monitoring | API Observability |
|---|---|---|
| Core focus | API availability and uptime | API behavior and internal execution |
| Main question answered | Is the API working? | Why is the API behaving this way? |
| Level of visibility | Surface-level | Deep, internal visibility |
| Data used | Status codes, response time, uptime | Logs, metrics, and distributed traces |
| Scope | Individual endpoints | End-to-end request flow |
| Debugging support | Limited | Strong root-cause analysis |
| Failure detection | Detects obvious outages | Detects hidden and partial failures |
| Microservices support | Weak for complex systems | Designed for distributed systems |
| User impact insight | Minimal | High |
| Best suited for | Alerts and basic health checks | Production debugging and reliability |
Monitoring helps me know when something is wrong.
Observability helps me understand where, why, and how it is happening.
How API Monitoring Works
API monitoring focuses on surface-level health checks.
It answers questions like:
-
Is the API reachable?
-
Is it responding correctly?
-
Is response time within limits?
-
Are error rates increasing?
Monitoring is reactive. It detects problems only after they become visible.
But monitoring usually cannot explain:
-
Why latency increased
-
Which internal service failed
-
How the issue affected specific users
How API Observability Works
API observability focuses on internal execution and request flow.
It helps answer:
-
Why is latency increasing only for certain requests?
-
Which downstream service is causing delays?
-
What changed before failures started?
-
How did this request move through services?
Observability is diagnostic, not reactive. It explains failures instead of just alerting on them.
The Four Pillars of API Observability
Strong API observability relies on four complementary pillars.
The first three explain what happens in production. The fourth ensures those learnings prevent future failures.
1) Logs: Understanding Individual API Requests
Logs are my first stop during incidents.
Well-structured API logs capture:
-
Request and response details
-
Headers and parameters
-
User or request identifiers
-
Error context
When logs are structured and searchable, debugging becomes focused instead of chaotic. I can trace a single request across services instead of scanning thousands of unrelated log lines.
Without proper logs, production debugging becomes guesswork.
2) Metrics: Identifying Patterns Over Time
Metrics show trends that logs alone cannot.
The key metrics I track are:
-
Request throughput
-
Error rate
-
Latency percentiles such as P95 and P99
Average latency can look healthy while users still suffer.
A rising P95 latency is often an early signal of deeper issues. It usually points to bottlenecks that affect real users long before averages reflect the problem.
Metrics help me detect problems before they escalate.
3) Traces: Finding the Exact Bottleneck
Distributed tracing changed how I debug APIs.
With traces, I can clearly see:
-
Which service handled each request step
-
Where time was actually spent
-
Which dependency caused delays or failures
In microservices, a single API call often touches many services. Tracing removes assumptions and speeds up root-cause analysis. Instead of guessing which service failed, I can see the exact request path within seconds.
4) From Observability to Prevention: Turning Signals Into Guardrails
Logs, metrics, and traces help me understand what happened in production. But understanding alone is not enough if the same failures keep repeating.
The real value comes when observability data is used to prevent regressions, not just explain incidents.
Pattern 1: Use observability data to decide what deserves tests
Not all APIs carry the same risk. Observability helps identify which endpoints matter most.
By analyzing traces and logs, I can pinpoint:
-
High-traffic endpoints
-
Routes with the highest error rates
-
APIs with slow P95 or P99 latency
-
Paths that frequently cause incidents after deployments
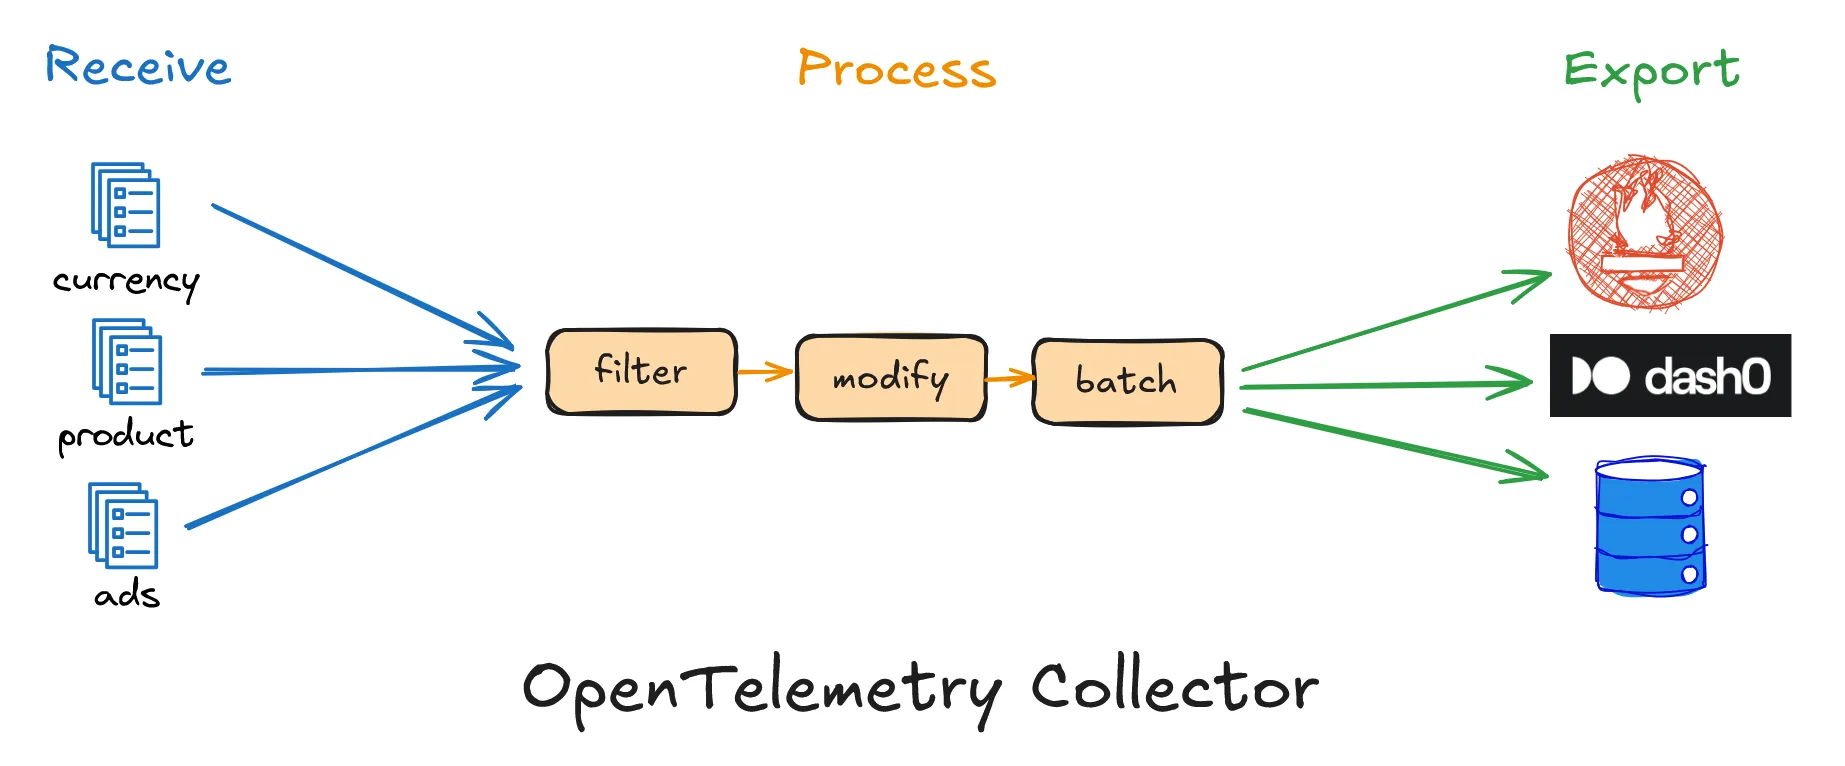
Once these high-risk APIs are visible, tools like Keploy can be used to record real requests and responses, ideally in staging or canary environments. These recordings can then be converted into deterministic API and integration tests and replayed on every pull request or release.
The outcome is that observability dashboards effectively become a prioritized test backlog, guiding where test coverage matters most.
Pattern 2: Correlate test replays with trace IDs
In systems that propagate correlation headers such as traceparent or x-request-id, those identifiers can be preserved during traffic capture and replay.
This allows:
-
Replay failures to be mapped back to the same request patterns seen in traces
-
Engineers to jump directly from CI failures to relevant trace views
-
Faster and more precise debugging
The outcome is a tighter loop between CI failures and production diagnostics.
Pattern 3: Treat test replays as observability signals
Test execution itself can generate useful telemetry.
Replay activity can produce:
-
Metrics such as pass rate, diff rate, flaky rate, and schema drift
-
Logs that capture replay differences with payload redaction
-
Traces that represent test-replay spans per endpoint or scenario
When these signals are exported into the existing observability stack, teams can view service health and test health in one place, instead of treating them as separate concerns.
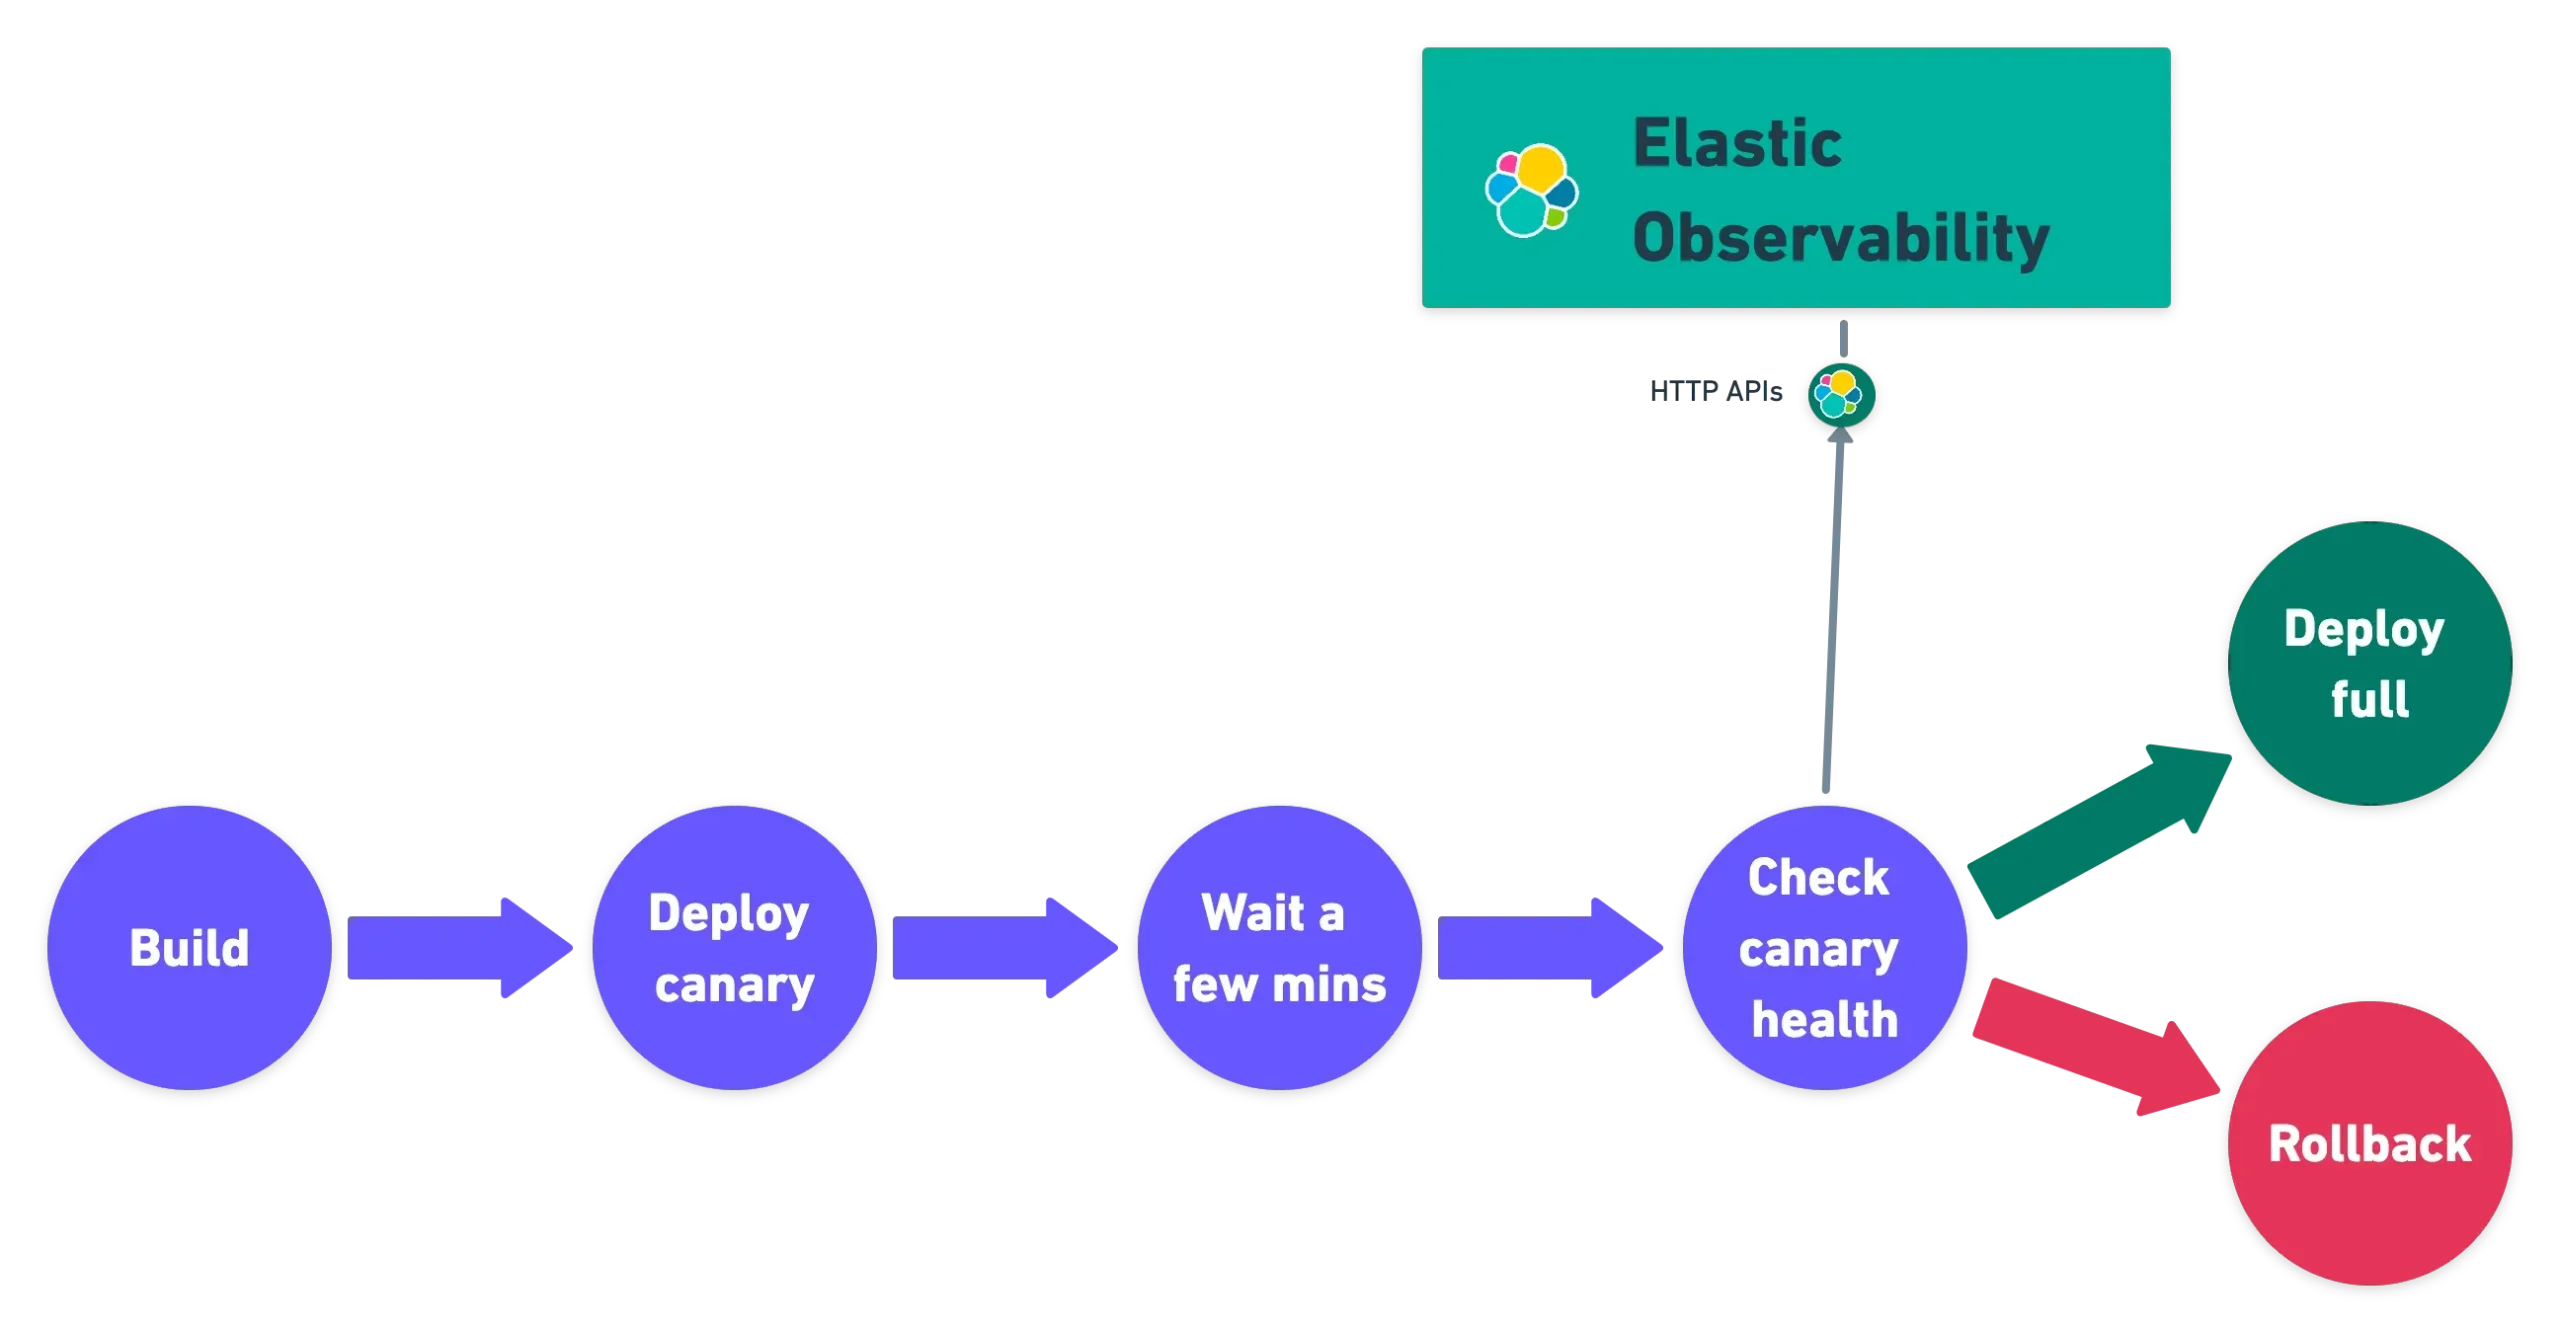
Pattern 4: Use SLOs and error budgets to gate risky deployments
Observability data can also shape deployment decisions.
For example:
-
APIs with strict SLOs require replay test suites to pass before deployment
-
Routes actively burning error budget are prioritized for increased capture and replay coverage
In this setup, error budgets are no longer just post-incident metrics. They actively influence CI policies and release readiness.
The outcome is fewer risky deployments and better alignment between reliability goals and delivery speed.
Real API Failures Observability Helps Catch
Not all API failures return errors.
Some of the most common production issues I’ve seen include:
-
Slow database queries hidden behind successful responses
-
Partial outages affecting only specific users or regions
-
Schema mismatches after backward-incompatible changes
-
Timeouts caused by third-party APIs
Without observability, these problems surface only when users complain. By then, trust is already impacted.
Where API Testing and Observability Connect
Observability helps me understand what broke in production.
Testing ensures the same issue doesn’t happen again.
One repeated problem I noticed was untested API paths. Real users trigger scenarios that mocks and static test data often miss.
By capturing real API traffic and converting it into test cases, production failures become reproducible in test environments. This creates a feedback loop where observability data improves test coverage.
Observability detects failures when they reach production.
Testing prevents the same failures from reaching users again.
Common API Observability Mistakes I See
I’ve made many of these mistakes myself.
Logging without structure
Too many unstructured logs increase cost and reduce clarity. They slow debugging instead of helping it.
Relying only on dashboards
Dashboards look good but lack the context needed to investigate real issues.
Ignoring traces
Without traces, root-cause analysis becomes slow and assumption-driven.
Adding observability too late
Retrofitting observability after scaling is painful and expensive.
How I Approach API Observability Today
This is how I work with APIs now:
-
Structured logs with proper request context
-
Meaningful latency and error metrics
-
Distributed tracing across services
-
Incident reviews after failures
-
Turning real incidents into test cases
APIs fail silently.
Observability helps me notice before users do.
Final Thoughts
Observing an API is more than just having tools at your disposal. It’s about creating an intuitive understanding of what the APIs do and how they interact with customers across different conditions.
Being able to explain an API’s problem with certainty allows me to fix the issue more quickly and with less anxiety. Consequently, observing an API is an integral part of maintaining a backend system in today’s environment.
FAQ
What is API observability?
API observability is the ability to understand what is happening inside an API using logs, metrics, and traces to analyze behavior and debug issues.
How is API observability different from API monitoring?
API monitoring checks whether an API is up or down, while API observability explains why an API behaves a certain way under real traffic.
Why is API observability important for microservices?
In microservices, a single API request touches multiple services. Observability helps identify bottlenecks, failures, and slow dependencies across systems.
What are the core components of API observability?
The core components are logs, metrics, distributed traces, and the practice of operationalizing those signals to prevent future issues.
Can API observability replace testing?
No. Observability helps detect issues in production, while testing prevents issues before deployment. Both are required for reliable APIs.

Leave a Reply