In today’s data-driven world, collecting data is easy, but making sense of it is what truly matters. That’s where Pandas pivot tables come into play. With just a few lines of Python, you can quickly turn disorganized data into meaningful, well-structured summaries.
Imagine Excel pivot tables, but faster, more flexible, and fully powered by code. Whether you’re comparing product performance, calculating metrics, or exploring patterns, pivot tables in Pandas make it easy to break down complex datasets and uncover insights even if you’re just getting started with Python.
In this guide, we’ll take you through a clear, step-by-step approach to using pivot tables in Pandas. Let’s unlock the full potential of your data.
What is Pandas?
Pandas is a robust Python open-source library that is mostly used for data analysis and manipulation. It enables you to use data structures like DataFrame and Series to work with structured data effectively.
Pandas allow you to:
-
Read and write datasets (CSV, Excel, JSON, SQL, etc.)
-
Preprocess and clean the data.
-
Execute statistical procedures.
-
Presenting informative visuals
-
Create pivot tables to gain more understanding.
What is a Pivot Table, and why do we need one?
A pivot table is an effective tool for grouping, filtering, and aggregating huge datasets for data summary. Without altering the original dataset, it facilitates the reorganization of raw data. Pivot tables enable you to dynamically examine data based on chosen rows, columns, and metrics rather than sorting or computing values by hand. It turns raw data into useful information.
Pivot tables in Pandas let you:
-
Data Grouping Made Simple
To make it easier to identify trends and patterns, sort and arrange your dataset according to one or more columns, such as category, department, or date. -
Use aggregations to summarize.
Use functions like count(), mean(), sum(), and others to extract insightful summaries from your data. For instance, average salary by department or total sales by region. -
Reshape for Explicitness
Convert your raw data into a more readable format by arranging specific values as rows, columns, or summaries. This will make it easier to understand complex data.
It’s like turning a messy spreadsheet into a clear, useful report. It’s great for dashboards, reporting tools, and getting data ready for machine learning.
In a nutshell, you can see the big picture with just a few lines of code when you use pivot tables.
How to Create a Pivot Table with Pandas in Python?
The pivot_table() method in Pandas is a versatile and strong function that allows you to specify how your data should be grouped, what values to aggregate, and how to arrange them across rows and columns in a single command. This allows you to quickly summarize and restructure your data.
Steps to start on Pivot Table:
-
Import the Pandas library – lets you get all the tools required to create a Pivot table
-
Load or create your dataset – here your data is present to be processed, which may be a simple data frame(quick testing) or CSV, Excel, API, or Databases
-
Use the pd.pivot_table() method – This is the main function to build a pivot table
python
import pandas as pd

# Create a simple dataset with department, employee, and salary information
data = {
    'Department': ['Sales', 'Sales', 'HR', 'HR', 'IT', 'IT'],
    'Employee': ['A', 'B', 'C', 'D', 'E', 'F'],
    'Salary': [50000, 60000, 45000, 47000, 70000, 72000]
}

# Convert dictionary to DataFrame
df = pd.DataFrame(data)

# Create a pivot table to calculate the average salary by department
pivot_table = pd.pivot_table(df, index='Department', values='Salary', aggfunc='mean')

# Display the pivot table
print(pivot_table)
Output:
plaintext
Department   Salary
HR           46000.0
IT           71000.0
Sales        55000.0
How to Create a Pandas Pivot Table (With Multiple Columns)?
Making a pivot table with multiple columns allows you to analyze data across multiple categories or groups, which leads to deeper insights. This is accomplished in Pandas by passing a list of column names to the pivot_table() function’s index, columns, or values parameters. This allows you to view your data in multiple dimensions in a single step.
Group and format data using multiple pivot parameters.
python
# Create a pivot table showing salary for each employee under each department
pivot = pd.pivot_table(
    df,
    index='Department',         # Row labels
    columns='Employee',         # Column labels
    values='Salary',            # Values to aggregate
    aggfunc='sum',              # Aggregation function
    fill_value=0                # Replace missing values with 0
)

# Display the pivot table
print(pivot)
Output:
plaintext
Employee        A      B      C      D      E      F
Department
HR              0      0  45000  47000      0      0
IT              0      0      0      0  70000  72000
Sales       50000  60000      0      0      0      0
How to Plot with a Pandas Pivot Table
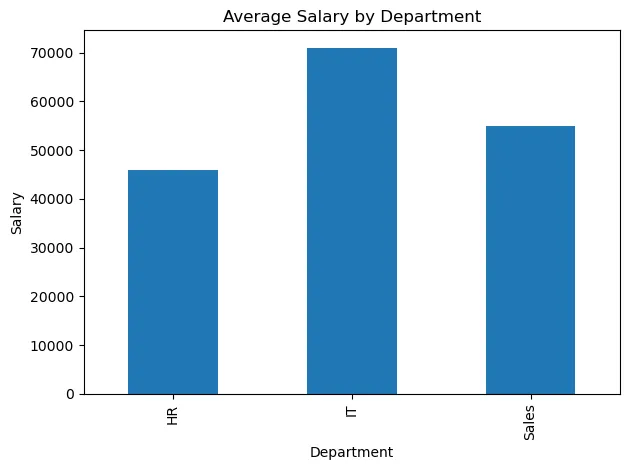
Visualizing your completed pivot table can make it easier to identify patterns, trends, and outliers. Pandas built-in plot() function (which uses Matplotlib underneath) allows you to transform raw numbers into dynamic visuals like bar charts, line graphs, or heat maps with just a line or two of code, enhancing the interactivity and insight of your analysis.
Visualize your pivot table using Matplotlib.
python
import matplotlib.pyplot as plt

# Plot a bar chart of the average salary by department
pivot_table.plot(kind='bar', legend=False)

# Set chart title and labels
plt.title('Average Salary by Department')
plt.ylabel('Salary')
plt.xlabel('Department')

# Adjust layout for better spacing
plt.tight_layout()

# Save the plot as an image (optional)
plt.savefig("avg_salary_barplot.png")

# Show the plot
plt.show()
Output:
How to Calculate with a Pandas Pivot Table?
Once your pivot table is created, you can use aggregation functions like sum, mean, count, min, or even custom functions to do calculations right within it. With only one line of code, you can efficiently summarize data and extract insights without writing intricate loops or performing calculations by hand.
-
Perform direct calculations within the Pivot Table
python
# Add a new column to calculate a 10% salary increase
pivot_table['Salary Increase'] = pivot_table['Salary'] * 1.10

# Display updated pivot table
print(pivot_table)
Output:
plaintext Salary Salary Increase Department HR 46000.0 50600.0 IT 71000.0 78100.0 Sales 55000.0 60500.02.Utilize the built-in Aggregation Function
python
# Create pivot table to count employees in each department
pivot_table = pd.pivot_table(df, index='Department', values='Employee', aggfunc='count')

# Display the pivot table
print(pivot_table)
Output:
plaintext Employee Department HR 2 IT 2 Sales 23.Apply conditional logic for custom calculations
python
# Add a 'Bonus' column based on salary thresholds
pivot_table['Bonus'] = pivot_table['Salary'].apply(lambda x: 5000 if x > 60000 else 3000)

# Display the pivot table with calculated bonus
print(pivot_table)
Output:
plaintext
             Salary  Salary Increase  Bonus
Department
HR          46000.0          50600.0   3000
IT          71000.0          78100.0   5000
Sales       55000.0          60500.0   3000
How to Style Your Pandas Pivot Table
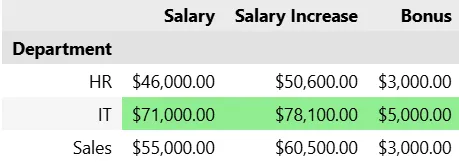
You can improve the readability, visual appeal, and presentation readiness of your data by styling your Pandas pivot table. You can highlight important values, apply number formatting, and draw attention to patterns using basic Pandas styling functions like .style.format(),.style.highlight_max(), or color gradients without changing the underlying data.
Utilize the built-in styling tools to enhance the formatting and readability of tables.
python
pivot_table.style.format('${:,.2f}').highlight_max(color='lightgreen')
Output:
Advantages of Pandas Pivot Tables
Before we wrap up, let’s understand why pivot tables in Pandas are worth learning.
-
Quick summarization – Easily group and summarize data by any feature.
-
Customizable calculations – Whether it’s average, sum, or your own function, you’re in control.
-
Efficient with large datasets – No lag, no crashes—just smooth performance.
-
Integrates well with Python ecosystem – Works seamlessly with visualization libraries like Matplotlib or Seaborn.
-
Automatable – Create repeatable, shareable reports using code, not clicks.
In short, if you’re dealing with recurring data tasks, pivot tables save time, reduce errors, and give cleaner insights—all with a few lines of Python.
What is the Difference Between Pandas Pivot and Excel Pivot?
| Features | Pandas Pivot Table | Excel Pivot Table |
|---|---|---|
| Creation Method | pd.pivot_table() function in code | Insert → PivotTable (GUI-based) |
| Data Sources | CSV, SQL, APIs, DataFrames | Excel sheets, CSV |
| Aggregation function | Uses sum(), mean(),count() and other custom logic as functions | uses =SUM(A1:A15) also limited built-in functions |
| Styling | Programmable (style.format(), highlight_max()) | Conditional formatting manually |
| Visualization | Uses matplotlib, seaborn | Uses built-in charts |
| Performance(Large data) | Handles smoother and faster | Slower, memory-limited |
What is the Difference Between Pandas and Excel?
When comparing two effective tools, which one should you use?
| Features | Pandas | Excel |
|---|---|---|
| Platform | Open-source | Proprietary(Microsoft) |
| Interface | Code based(Python) | GUI(Drag and Drop) |
| Data Volume Handling | Handling large files smoothly | Slow down with large files |
| Automation | Fully Scriptable | Need manual steps |
| Flexibility | High – Write any logic | Limited – Restricted to Excel’s tools |
| Collaboration | Git, Notebooks, shared scripts | Excel files via email or cloud |
| Use Cases | Programmers, analysts, data scientists | General users and office professionals |
What Makes Keploy Special for Python Developers
Here are some reasons Python developers prefer to use Keploy:
If you’re developing an application in Python and want to test it with Keploy, it’s incredibly easy—you don’t need to write any code! Sounds interesting? With Keploy, you can perform unit, integration, and API testing without writing a single line of test code. Let’s dive deeper into how Keploy helps you test your application. The best part? Keploy supports test case generation regardless of your tech stack.
-
Keploy API Testing:
Keploy’s API Testing agent helps you create API test cases in just a few minutes. The best part? Keploy automatically tests the AI-generated test cases by hitting your application’s URL. You can even try API testing locally and use the Keploy Chrome extension to record your API test cases effortlessly.
-
Try it out here: app.keploy.io
-
To try Keploy Chrome Extension: Chrome webstore
-
Keploy Unit Testing:
Keploy uses AI to auto-generate unit tests directly within GitHub PRs by analyzing code changes. Tests are suggested inline and validated before being surfaced — ensuring they build, pass, and add meaningful new coverage.
-
PR Agent: Connects directly to GitHub, analyzes code changes, and auto-suggests unit tests. It ensures any new code is covered with tests, providing instant AI feedback right within your PR, saving time and improving code quality. To try PR Agent use this link: Github marketplace
-
VS Code Extension: Brings Keploy’s test generation features into your editor. With just one click, you can generate, run, and view tests, making it easy to catch edge cases and debug faster without ever leaving VS Code. To try VS Code Extension use this link: Visual studio marketplace
-
Keploy Integration Testing:
Keploy has built the world’s first eBPF-based network proxy that records API interactions as test cases and mocks them. These interactions are then replayed as full integration tests. Best of all, there are no code changes required for integration. To know more about: Integration Testing
Keploy also has a Quickstart guide to help you get started with integration testing for your Python application Check out here
Conclusion
Pandas pivot tables are useful for more than just rearranging your data; they can also be used to uncover patterns, obtain insights, and quickly make data-driven decisions. Pandas pivot tables can be used to reshape and summarize large datasets for analysis of employee statistics, customer behavior, or sales performance with just a few lines of code.
Through grouping, aggregating, calculating, styling, and visualizing, they help close the gap between raw data and insightful understanding in Python’s rich data ecosystem. To become a confident and successful engineer or data analyst, one must be proficient in them.
FAQs
1. When should you use pandas.pivot() and pandas.pivot_table()?
Use pivot() when your data is clean and there are no duplicate entries for the combination of index and columns. Use pivot_table() when your data may contain duplicates, and you want to apply an aggregation function like mean() or sum().
2. Can I create pivot tables in Pandas from CSV or Excel files?
Absolutely! Use pd.read_csv() or pd.read_excel() to load data into a DataFrame, and then apply pd.pivot_table():
```
python
df = pd.read_csv('data.csv')
pivot = pd.pivot_table(df, ...)
```
<h3>3. <strong>How should missing values in a pivot table be handled?</strong></h3>
<p>Use the fill_value parameter in pivot_table() to substitute missing values with a default (e.g., 0 or "N/A"):</p>
<pre><code>```
python
pd.pivot_table(df, values='Sales', index='Region', columns='Product', fill_value=0)
“`
4. Can a single pivot table use multiple aggregation functions?
Yes! Use the aggfunc parameter with a list of functions, also see the implementation below.
```
python
pd.pivot_table(df, values='Salary', index='Department', aggfunc=['mean', 'max', 'count'])
```
5. How is a Pandas pivot table different from an Excel pivot table?
Pandas pivot tables are code-based, allowing for automation, reproducibility, and integration into data pipelines. Excel pivot tables are GUI-based and better suited for manual, interactive data exploration.

Leave a Reply