MTTR is the metric that tells you how long your users wait after something breaks. According to Splunk and Cisco’s Hidden Costs of Downtime 2026 report, unplanned downtime now costs organisations an average of $15,000 per minute.
Across the Global 2000 companies, the aggregate annual cost has surged to $600 billion, a 50% increase in just two years. Engineering teams shipping to production multiple times a day face a simple reality: incidents aren’t a matter of if. They’re a matter of when. What separates teams that absorb those incidents cleanly from teams that lose hours to them is how well they’ve built their recovery process. MTTR is how you measure that.
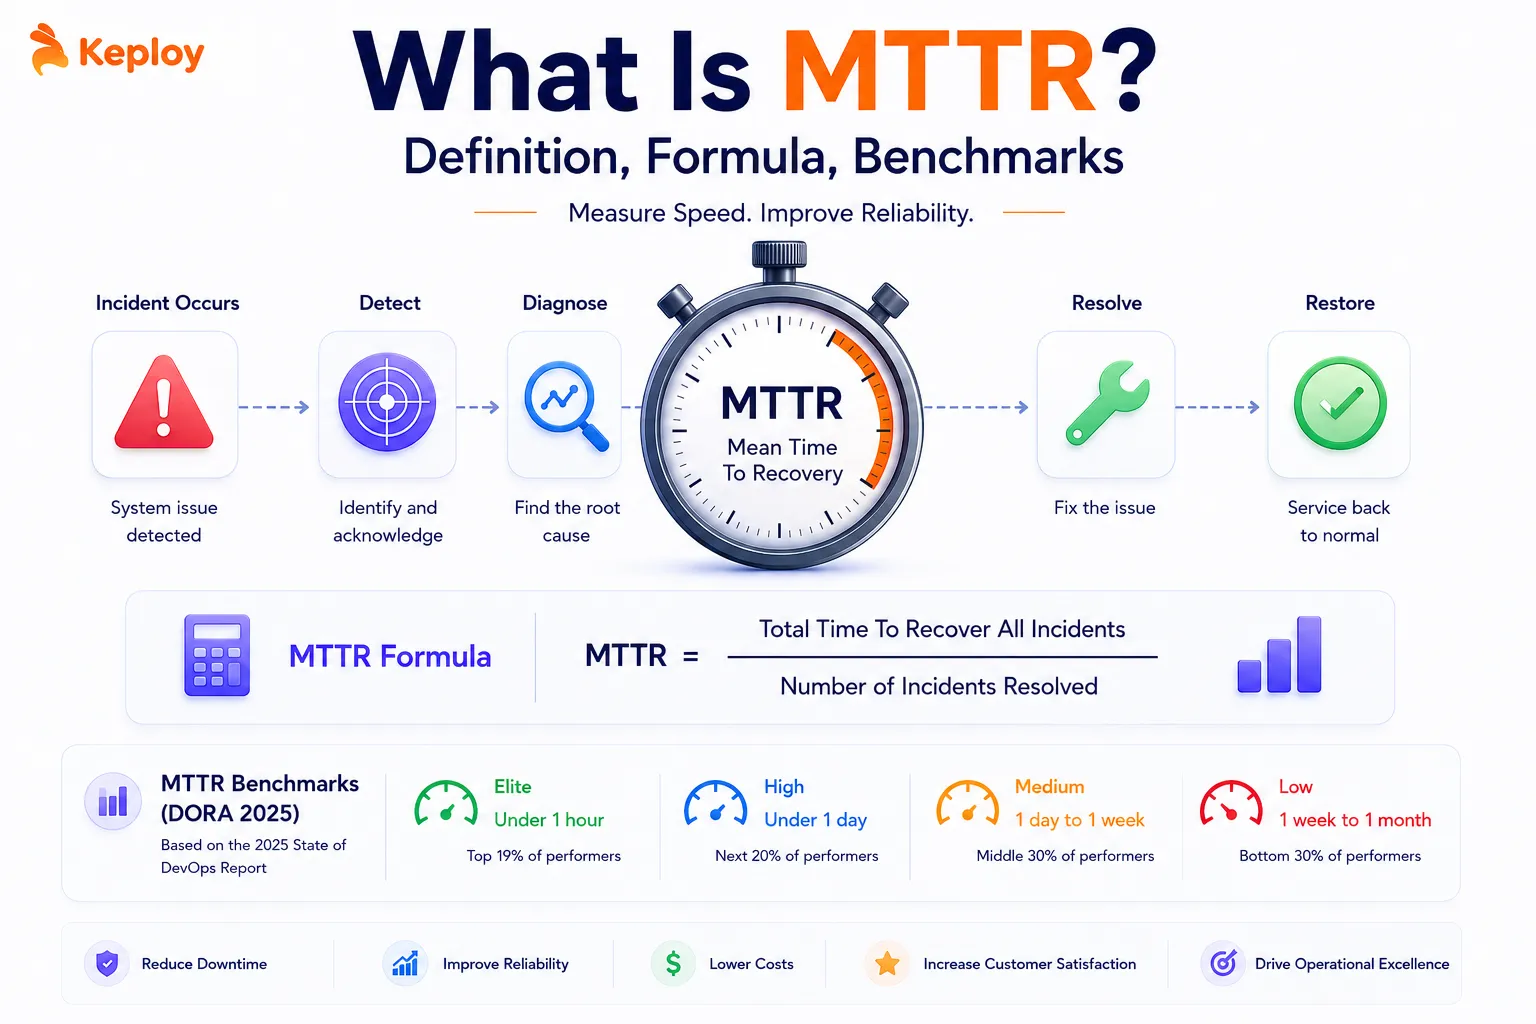
What Is MTTR?
MTTR stands for Mean Time to Recovery, the average time it takes for a system to return to full operation after a failure or disruption. It’s calculated from the moment an incident is detected to the moment service is fully restored. Every minute in between counts: detection time, diagnosis time, fix time, deployment time, verification time. The metric captures all of it.
MTTR is one of the five DORA metrics used by engineering teams to measure delivery performance and reliability. A low MTTR signals a resilient system and a team that can respond to failures quickly and systematically. A high one signals fragility somewhere in the stack: in observability, incident process, code quality, or deployment infrastructure.
Mean Time to Recovery vs Mean Time to Resolution: The Four Rs Explained
The "R" in MTTR doesn’t always mean the same thing. Depending on who’s defining it, MTTR can refer to Repair, Recovery, Restore, or Resolution. Each has a slightly different scope.
|
Variant |
Full name |
Clock stops when… |
Primary context |
|
Repair |
Mean Time to Repair |
The technical fix is applied |
Manufacturing, hardware, IT infrastructure |
|
Recovery |
Mean Time to Recovery |
Full service functionality is restored to users |
Software engineering, DevOps, SRE |
|
Restore |
Mean Time to Restore Service |
Service is fully restored (DORA’s specific definition) |
DORA metrics, engineering performance |
|
Resolution |
Mean Time to Resolution |
Root cause is identified and permanently resolved |
ITSM, customer support, SLA management |
For software engineering teams, Mean Time to Recovery and Mean Time to Restore are effectively the same thing. DORA uses "Restore" but the concept is identical. Mean Time to Resolution goes further by requiring root cause elimination, not just service restoration.
Throughout this guide, MTTR refers to Mean Time to Recovery: the time from incident detection to full service restoration.
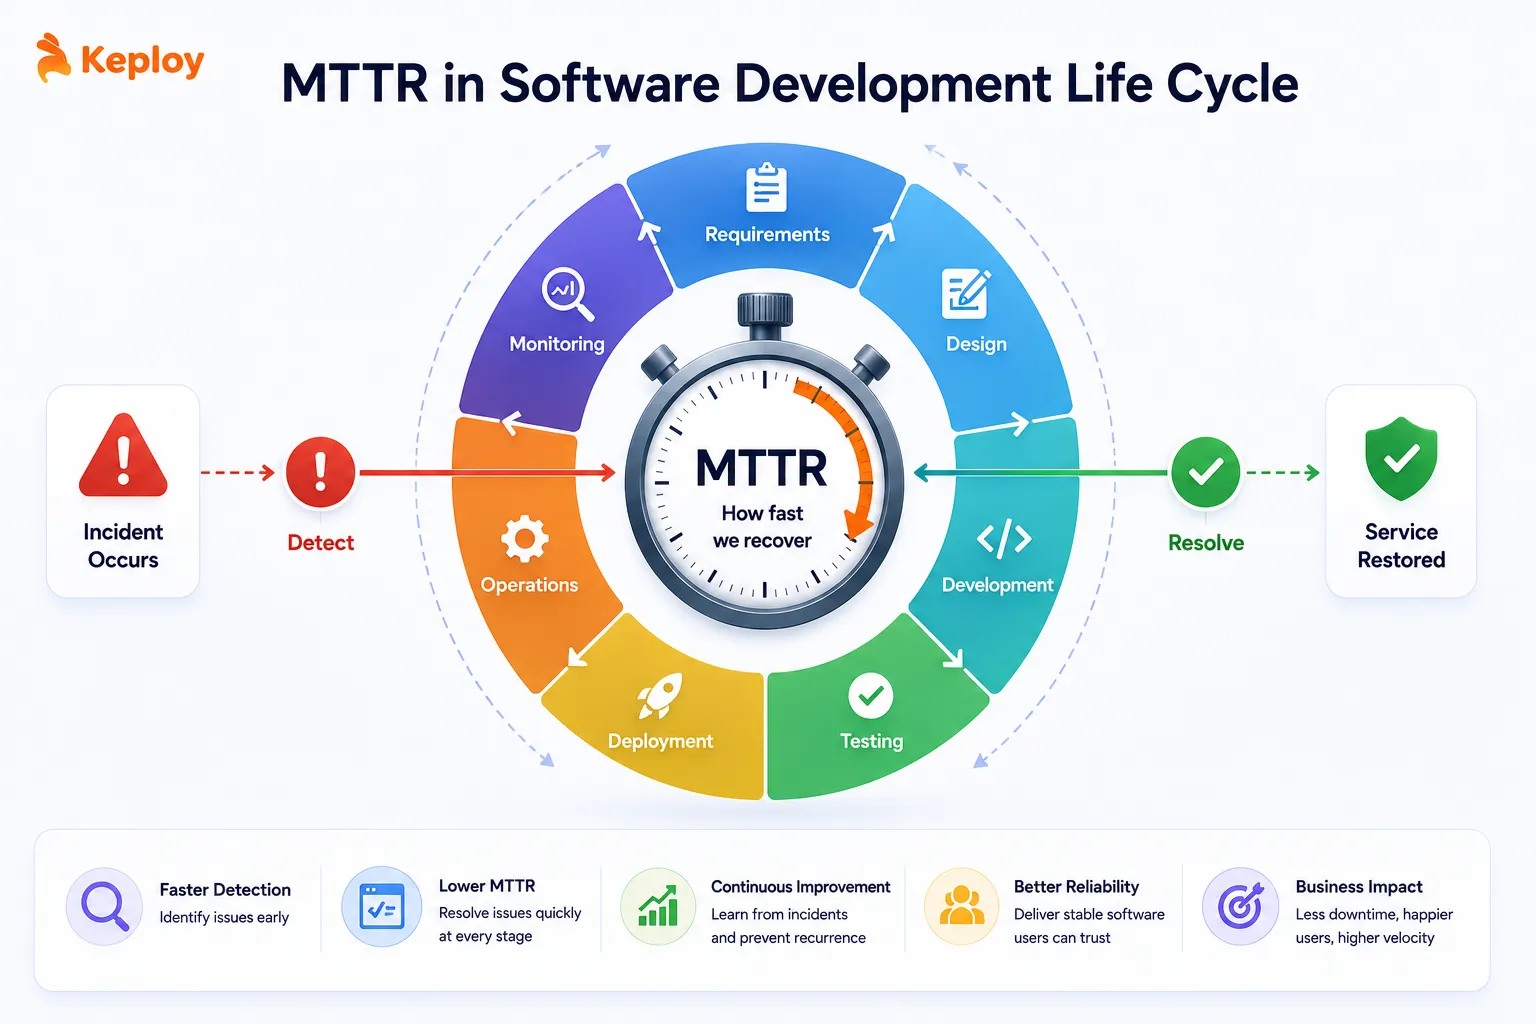
MTTR in Software Engineering and the SDLC
MTTR originated in manufacturing, where it tracked how long technicians took to repair physical equipment. In that context, the "R" was always Repair and the goal was straightforward: get the machine running again.
Software engineering borrowed the metric but changed what it measures. Code doesn’t wear out. Services fail because of bad deployments, dependency outages, data issues, or infrastructure problems. Recovery doesn’t mean fixing hardware. It means identifying what broke, rolling back or patching, and confirming that users can access the system normally again.
MTTR in the SDLC shows up at multiple stages, not just in production:
-
Development and testing: When a bug is found during testing, the time from discovery to fix is a form of MTTR. Teams that track this internally use it to identify systemic gaps in test coverage or code review quality.
-
Deployment: Failed deployments that require rollback contribute directly to production MTTR. The faster a team can detect a bad deploy and roll back, the lower their MTTR on deployment-related incidents.
-
Production: This is where MTTR is most commonly tracked. A production incident (whether from a regression, infrastructure failure, or third-party outage) starts the MTTR clock the moment monitoring detects it.
Teams that track MTTR across all three stages rather than just production get a more complete picture of where recovery capability is weakest.
MTTR in DORA Metrics
DORA (DevOps Research and Assessment) is Google’s research program measuring software delivery performance across thousands of engineering organisations. The 2024 DORA report expanded the framework to five metrics: Deployment Frequency, Lead Time for Changes, Change Failure Rate, Failed Deployment Recovery Time (MTTR), and Deployment Rework Rate, the fifth metric added in 2024, measuring the proportion of deployments that require rework after release.
MTTR sits within the DORA framework alongside Change Failure Rate and Deployment Rework Rate on the stability side. Where Deployment Frequency and Lead Time measure speed, MTTR, Change Failure Rate, and Deployment Rework Rate measure resilience. DORA’s research consistently shows that elite teams achieve high performance on both speed and stability. The two don’t trade off against each other the way many teams assume.
One terminology note worth knowing: the 2023 DORA report renamed MTTR to "Failed Deployment Recovery Time" (FDRT), refining the definition to focus strictly on restoring service after a software change caused an impairment rather than any incident, including external factors like data center outages. In 2025, DORA renamed its annual publication to "State of AI-assisted Software Development" and officially confirmed the evolution from four to five metrics. Benchmark values are unchanged, and MTTR remains the widely used industry shorthand.
DORA benchmarks (State of AI-assisted Software Development 2025):
|
Performance tier |
MTTR target |
|
Elite |
Less than 1 hour |
|
High |
Less than 1 day |
|
Medium |
Between 1 day and 1 week |
|
Low |
Between 1 week and 1 month |
Elite teams recovering in under an hour aren’t just lucky. They’ve invested in observability, automated rollback, and incident runbooks that make recovery fast and repeatable. Getting from Medium to High performance on MTTR typically involves fixing the detection and diagnosis phases, which is where most teams lose time.
For a broader look at how MTTR fits alongside the other four DORA metrics, Keploy’s guide on how to improve DORA metrics covers the full framework.
MTTR in DevOps and Incident Management
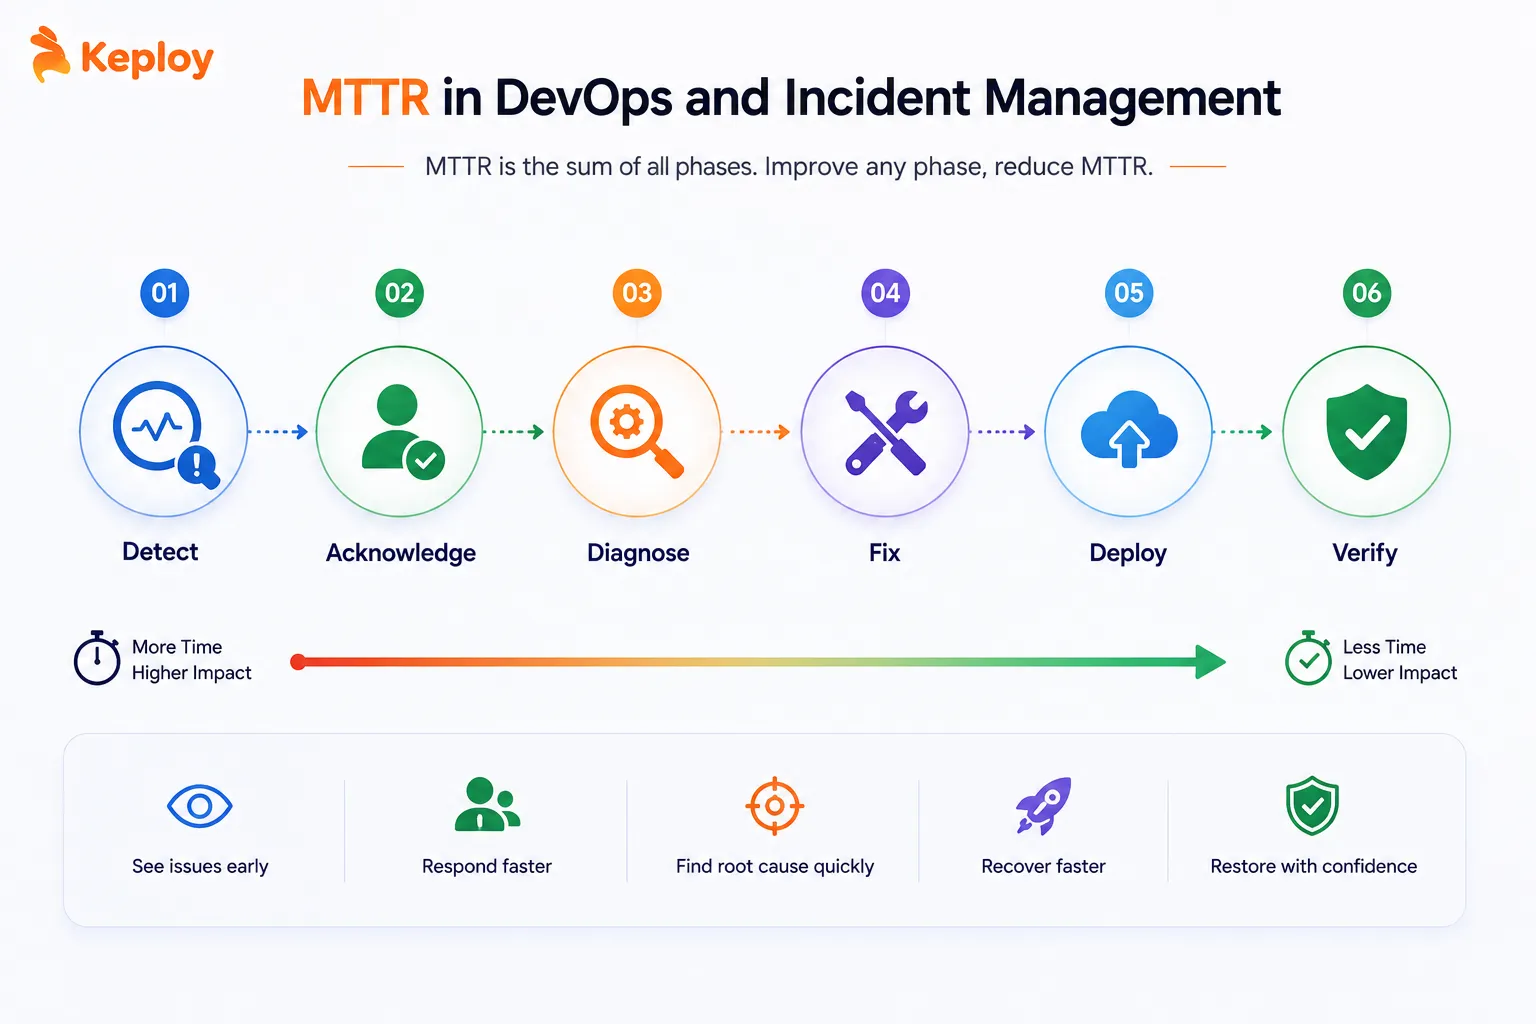
In DevOps, MTTR is inseparable from how a team handles incidents. The incident lifecycle has six distinct phases, each of which contributes to total MTTR:
-
Detection: Monitoring or alerting identifies that something is wrong. Good observability (structured logging, distributed tracing, real-time dashboards) means detection happens in seconds. Without it, engineers find out from users.
-
Acknowledgement: An engineer takes ownership of the incident. Slow acknowledgement (when alerts sit unread or nobody is on-call) is one of the most common reasons MTTR bloats unnecessarily.
-
Diagnosis: The team identifies what broke and why. This is usually the longest phase. Without clear logging and distributed tracing, engineers spend most of their incident time guessing rather than fixing.
-
Fix: The actual change is made: a rollback, a hotfix, a configuration change, or a mitigation.
-
Deployment: The fix reaches production. Teams with automated deployment pipelines compress this phase to minutes. Teams with manual deploy processes add hours.
-
Verification: The team confirms the service is fully restored and the incident is closed. Skipping this step means incidents get closed prematurely and reopen.
MTTR is the sum of all six phases. Improving any one of them reduces the total. Most teams focus on the fix phase because it’s the most visible, but detection and diagnosis usually account for the majority of total incident time.
Tools teams commonly use to track and manage MTTR:
-
PagerDuty and OpsGenie for incident alerting, on-call management, and automatic MTTR calculation from incident timestamps
-
Datadog, New Relic, and Dynatrace for observability, providing the logs, traces, and metrics that reduce diagnosis time
-
StatusPage for communicating incident status externally while tracking resolution time internally
-
Jira Service Management and ServiceNow for ITSM-focused incident tracking in larger organisations
How to Calculate Your MTTR Score
The formula is straightforward:
MTTR = Total recovery time across all incidents / Number of incidents
If your team had three incidents in a month lasting 45 minutes, 2 hours, and 75 minutes, your MTTR is:
(45 + 120 + 75) / 3 = 80 minutes
That puts you in the High tier by DORA benchmarks, better than a full day but not yet under an hour.
A note on mean vs median: The formula above uses mean (average). In practice, a single major incident with a 12-hour recovery can inflate your mean MTTR significantly while most incidents resolve quickly. Many engineering teams track both mean and median MTTR. The median gives a more representative picture of typical recovery speed, while the mean highlights the impact of outliers.
What counts as a resolved incident?
This is where teams get inconsistent. A common mistake is closing incidents when symptoms disappear rather than when the root cause is addressed. Two definitions worth using:
-
Service restored: Users can access the system normally. DORA uses this as the clock stop.
-
Root cause resolved: The underlying issue is fixed and won’t recur. This is closer to Mean Time to Resolution.
For DORA tracking, use service restoration as the endpoint. For engineering quality tracking, add root cause resolution as a separate metric.
MTTR vs MTBF, MTTD, and MTTF
MTTR doesn’t exist in isolation. Engineering teams track it alongside several related "mean time" metrics. Here’s how they differ:
|
Metric |
Full name |
What it measures |
Formula |
Use it for |
|
MTTR |
Mean Time to Recovery |
Average recovery time after failure |
Total recovery time / Number of incidents |
Measuring recovery speed and resilience |
|
MTBF |
Mean Time Between Failures |
Average time between failures |
Total uptime / Number of failures |
Measuring reliability and failure frequency |
|
MTTD |
Mean Time to Detect |
Average time between failure start and detection |
Total detection delay / Number of incidents |
Measuring observability effectiveness |
|
MTTF |
Mean Time to Failure |
Average time until first failure (for non-repairable systems) |
Total operating time / Number of failures |
Hardware reliability, SLA modelling |
-
MTTR and MTBF work together. MTTR tells you how fast you recover. MTBF tells you how often you need to. A team with a 30-minute MTTR but a 2-hour MTBF is still spending a lot of time in incidents. The goal is high MTBF (failures are rare) and low MTTR (recovery is fast).
-
MTTD is MTTR’s most underrated companion. Detection time is part of total MTTR, but many teams don’t track it separately. Teams at companies like Netflix and Google have invested heavily in MTTD specifically, because an incident you detect in 30 seconds is fundamentally easier to recover from than one you discover 45 minutes later.
How to Reduce MTTR: Practical Strategies
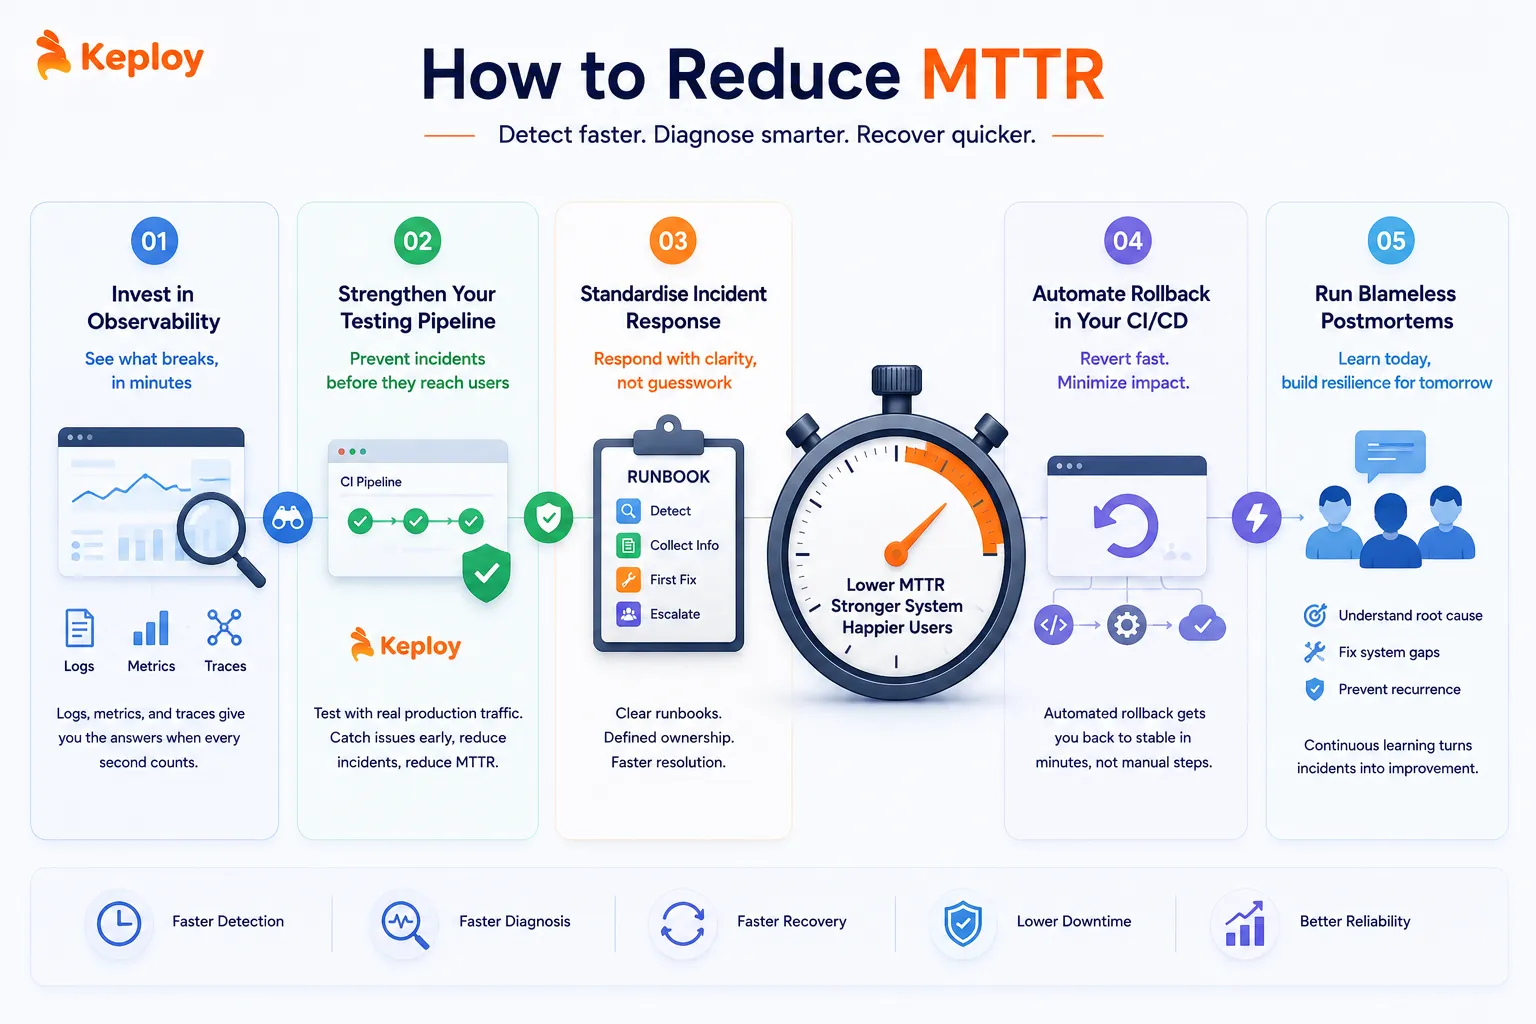
Invest in observability before you need it
You can’t recover quickly from something you can’t see. Observability means having the logs, metrics, and traces in place to answer "what broke?" in minutes rather than hours.
Distributed tracing (Jaeger, Zipkin) shows exactly which service in a chain is failing. Structured logging gives you searchable context when you’re under pressure during an incident. Real-time dashboards reduce the time between failure and detection. Teams at Netflix and Spotify treat observability infrastructure as load-bearing, not something to add after stability becomes a problem.
Strengthen your testing pipeline to prevent incidents
Most MTTR improvement advice focuses on what happens after an incident starts. But the fastest way to reduce MTTR is to have fewer incidents.
Every production incident that automated testing could have caught before deployment adds to your MTTR statistics unnecessarily. A regression in an API endpoint that a good integration test would have flagged in CI doesn’t become a 45-minute production incident. It becomes a 5-minute pipeline failure that the developer fixes immediately.
Tools like Keploy capture real API traffic from production and convert those interactions into regression tests that run on every pull request. Because these tests are built from actual user behavior rather than anticipated scenarios, they cover the edge cases most likely to cause production incidents. When an incident does occur, engineers also have existing test cases covering the affected API paths, cutting diagnosis time by giving them an immediate reproduction scenario rather than having to reconstruct one from logs.
This shifts MTTR improvement upstream: fewer incidents means fewer contributions to the metric, and faster diagnosis when incidents do occur means the ones that happen resolve faster.
Standardise your incident response with runbooks
LinkedIn’s engineering team has published data showing that standardised processes and clear ownership significantly improve MTTR. Teams that document their incident response (who does what, in what order, using which tools) recover faster because engineers don’t spend time figuring out procedure while the incident is active.
A runbook doesn’t need to be long. For each major failure mode, document: how to detect it, what information to collect, what the first fix attempt is, who to escalate to if that doesn’t work. The goal is to turn incident response from improvised firefighting into a repeatable process.
Automate rollback in your CI/CD pipeline
Deployment-related incidents are often the fastest to recover from, if rollback is automated. When a bad deployment triggers an alert, an automated rollback pipeline can have the previous version in production in under three minutes. Without automation, the same rollback might take 20 minutes of manual steps.
GitHub Actions, ArgoCD, and most modern CI/CD platforms support automated rollback triggers. Setting a deployment quality gate that automatically rolls back when error rates spike after a deploy is one of the highest-ROI investments for MTTR reduction.
Run blameless postmortems after every significant incident
Amazon’s engineering culture treats every production incident as a learning opportunity rather than a disciplinary event. Blameless postmortems ask "what in the system allowed this to happen?" rather than "who made the mistake?"
Over time, this approach identifies systemic gaps: missing alerts, insufficient test coverage, and deployment processes with too many manual steps. Teams that run structured postmortems consistently see MTTR trend downward because they’re eliminating the underlying conditions that make incidents hard to recover from, not just responding to individual failures.
Conclusion
MTTR is a simple metric with a deceptively complex set of levers. The formula is just recovery time divided by incidents. But what actually moves the number is a combination of observability depth, incident process maturity, deployment automation, and the quality of the testing pipeline upstream of production.
Teams that treat MTTR as purely an incident management problem only address the back half of the issue. The front half (reducing how often incidents happen and how quickly engineers can reproduce them when they do) is where the most durable improvements come from. The DORA benchmarks give you a concrete target. Under one hour is elite. If you’re not there yet, start with detection time. Most teams find that closing the gap between failure and alert cuts their MTTR faster than anything else.
Frequently Asked Questions
How is MTTR calculated?
MTTR = Total recovery time across all incidents divided by the number of incidents in a given period. If three incidents lasted 45, 120, and 75 minutes respectively, MTTR is (45 + 120 + 75) / 3 = 80 minutes. Track both mean and median. Mean is inflated by outliers, median gives a more representative view of typical recovery speed.
What is the difference between MTTR and MTBF?
MTTR measures how long recovery takes after a failure. MTBF measures how frequently failures occur. MTTR tells you about recovery speed; MTBF tells you about reliability. Both matter: a team with fast MTTR but frequent failures is still spending a lot of time in incidents. The goal is high MTBF (rare failures) combined with low MTTR (fast recovery when they do happen).
What is a good MTTR?
Per DORA’s State of AI-assisted Software Development 2025 report, elite-performing engineering teams achieve MTTR under one hour. High performers recover within one day. Medium performers take between one day and one week. If your team is currently in the Medium tier, focusing on detection time (MTTD) and diagnosis speed usually produces the fastest improvements.
What are the four Rs of MTTR?
Mean Time to Repair (technical fix applied), Mean Time to Recovery (full service restored), Mean Time to Restore (DORA’s term, service restored to users), and Mean Time to Resolution (root cause identified and permanently resolved). For software teams tracking DORA metrics, Recovery and Restore are effectively the same.
What tools are used to track MTTR?
PagerDuty and OpsGenie calculate MTTR automatically from incident timestamps. Datadog, New Relic, and Dynatrace reduce MTTR by improving detection and diagnosis speed. Jira Service Management and ServiceNow handle incident tracking in enterprise environments. Most teams feed incident data from these tools into DORA dashboards via platforms like LinearB, Faros, or Haystack.
How does automated testing reduce MTTR?
Automated testing reduces MTTR in two ways. First, it catches regressions before they reach production. Fewer incidents mean fewer contributions to MTTR. Second, when incidents do occur, existing test cases covering the affected code paths give engineers immediate reproduction scenarios, cutting diagnosis time significantly.

Leave a Reply