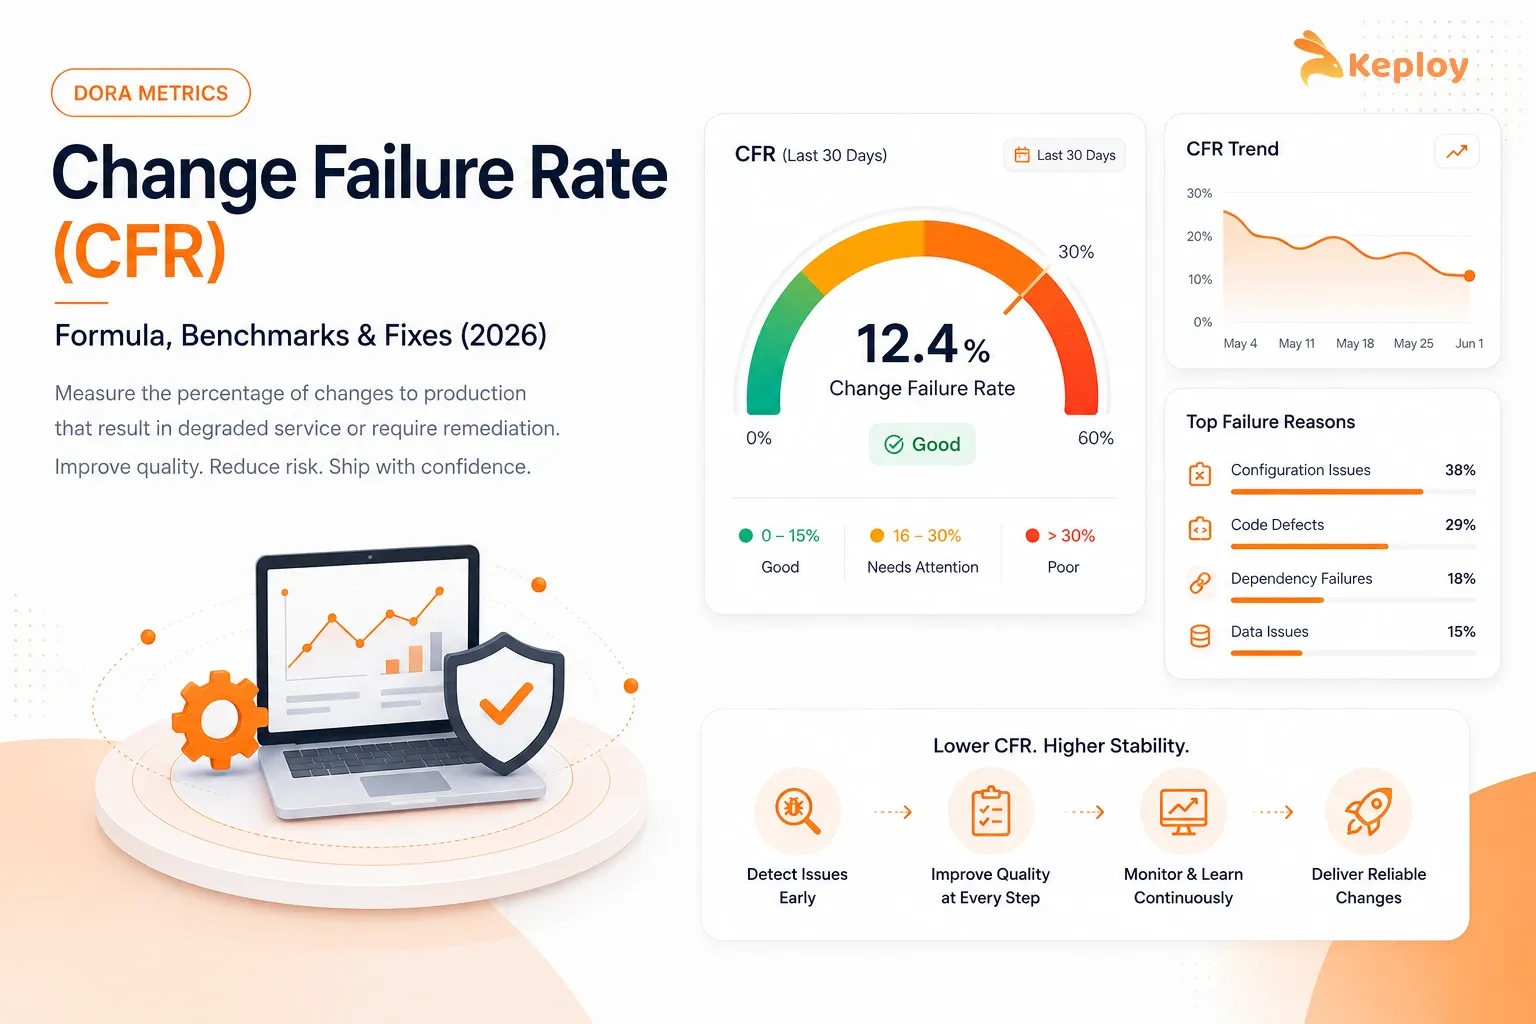
Change failure rate measures the percentage of production deployments that trigger a rollback, hotfix, or emergency patch, making it a stability signal rather than a speed metric. Even elite teams rarely hit a near-zero rate, since most spikes trace back to untested API regressions slipping through CI. Keploy generates regression tests from real traffic, catching these breaking changes before deployment raises CFR.
Change failure rate tells you something deployment frequency can’t. Whether the code you’re shipping is actually working when it gets there. Most teams track how often they deploy. Fewer track what percentage of those deployments immediately cause problems. That gap is where CFR lives.
A team deploying 50 times a week with a 30% failure rate isn’t performing well. It’s creating problems faster than it can resolve them. Change failure rate (CFR) is what makes that visible, and it’s one of the five DORA metrics the DORA research program uses to benchmark engineering delivery performance.
What is Change Failure Rate (CFR)?
Change failure rate (CFR) is the percentage of deployments to production that result in a failure requiring immediate remediation: a rollback, hotfix, or emergency patch. A lower CFR means deployments are reliable. A high CFR means the team is regularly shipping unstable code into production. Per the DORA State of AI-assisted Software Development 2025 report, elite teams achieve a CFR of 0-2%.
CFR is a stability metric. It measures not how fast you ship, but how cleanly you ship. A deployment that causes a production incident the moment it goes live counts. A deployment that runs perfectly doesn’t.
The metric matters because every failed deployment has a cost. Engineering time to diagnose the problem, deploy the fix, and confirm recovery. User-facing downtime or degradation while that happens. And a compounding effect on team confidence. Repeated production failures make developers cautious, which often slows deployment frequency in turn.
That’s the trap high CFR creates. Teams start shipping less often to reduce the chance of breakage. But less frequent deployments mean larger change sets per release, which actually increases the blast radius when something does go wrong.
What Counts as a CFR Failure?
Not every production issue qualifies. Getting this definition right matters because an inconsistent definition produces a metric nobody trusts.
Include in your CFR calculation:
-
Deployments that require a rollback to the previous version
-
Deployments that trigger a hotfix within a defined window (24-48 hours is typical)
-
Deployments linked to a P1 or P2 incident that required immediate response
-
Deployments that caused degraded service, even if not a full outage
Exclude from your CFR calculation:
-
Fix-only deployments (a hotfix is already a remediation, not a new failure)
-
Production issues caused by external factors: third-party outages, infrastructure provider failures, or network problems unrelated to the code change
-
Planned maintenance that causes temporary downtime
The fix-only exclusion is the one most teams get wrong. If a hotfix deployment causes a new problem, that second deployment counts as a failure. The original incident that triggered the hotfix does not itself add a second failure to the denominator.
CFR in the DORA Metrics Framework
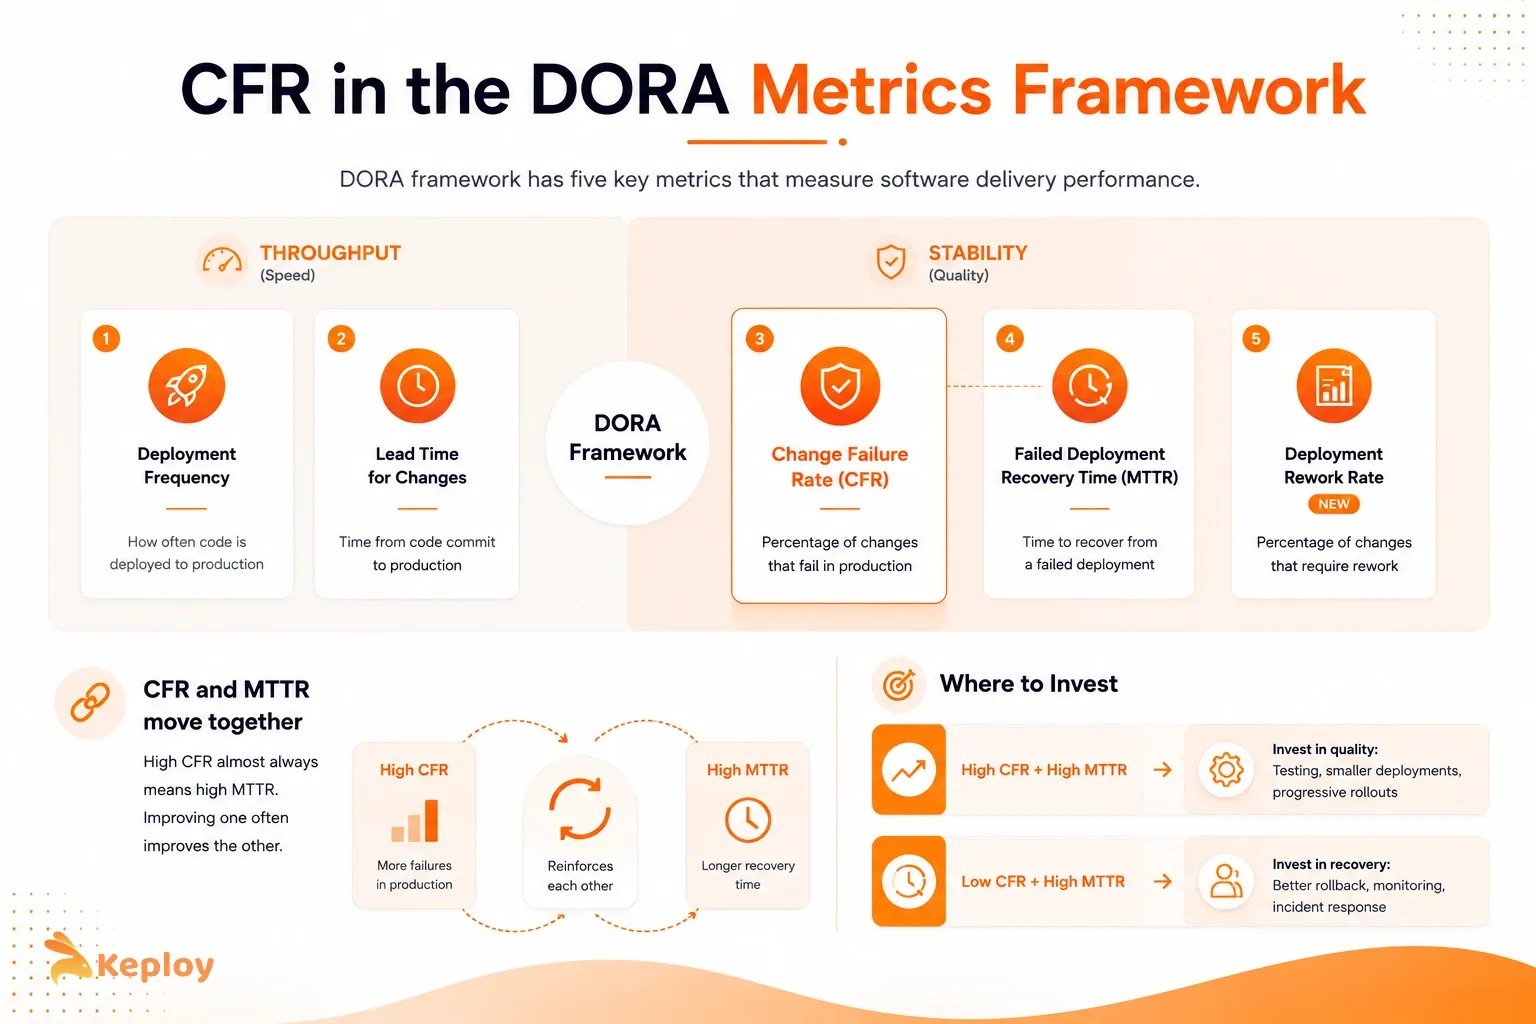
Change failure rate is one of the five DORA metrics, the framework developed by Google’s DevOps Research and Assessment program to measure software delivery performance. The five are: Deployment Frequency, Lead Time for Changes, Change Failure Rate, Failed Deployment Recovery Time (MTTR), and Deployment Rework Rate (added in 2024).
CFR sits in the stability half of the framework, alongside MTTR. Deployment Frequency and Lead Time measure throughput speed. CFR and MTTR measure what happens when that speed creates problems.
The two stability metrics move together. Teams with a high CFR almost always have a high MTTR, because frequent production failures mean frequent recovery events, and each recovery takes time. Conversely, the practices that reduce CFR (better testing, smaller deployments, progressive rollouts) also tend to reduce MTTR by making failures easier to diagnose and reverse.
This pairing matters when you’re deciding where to invest. If both CFR and MTTR are high, fixing the testing pipeline addresses CFR and often improves MTTR indirectly. If CFR is low but MTTR is high, the problem is in your recovery process, not your pre-deployment quality.
For a deep dive on MTTR specifically, read our guide on MTTR that covers the paired metric in full.
How Do You Calculate Change Failure Rate?
The change failure rate formula is:
CFR = (Number of failed deployments ÷ Total number of deployments) × 100
That gives you a percentage. The calculation runs over a rolling window: typically 30 days for operational visibility or 90 days for trend analysis.
Worked example:
A team deploys 40 times in a month. Three of those deployments require immediate remediation: one rollback and two hotfixes within 24 hours of deployment.
CFR = (3 ÷ 40) × 100 = 7.5%
At 7.5%, the team is above the elite benchmark of 0-2% but below the medium threshold of 10-15%. They’re in reasonable shape but have room to improve.
A second example: a team deploys 12 times in a month (weekly releases with one emergency patch). Two of the twelve deployments cause incidents.
CFR = (2 ÷ 12) × 100 = 16.7%
That’s above 15%, in the low-performing tier. And notably, this team is deploying infrequently. Each individual deployment carries more risk because it bundles more changes.
What to Include and Exclude from the Denominator
The denominator (total deployments) should include all production deployments during the measurement window. It should exclude:
-
Deployments to non-production environments (staging, testing, QA)
-
Fix-only deployments as discussed above
-
Infrastructure-only changes that don’t involve application code, if your team has chosen to track application CFR separately from infrastructure CFR
30-Day vs 90-Day Window
A 30-day window gives you more responsive operational data. You’ll see the impact of process changes faster. Whereas a 90-day window smooths out noise and gives a more stable trend signal. Most teams use 30 days for team-level dashboards and 90 days for leadership reporting.
Mean vs Median
If your team has occasional high-CFR months from major incidents, the mean will be pulled up by outliers. Tracking both mean and median gives a more complete picture. The mean shows impact from outliers; while the median shows typical performance.
Change Failure Rate Benchmarks and Industry Standards
The DORA State of AI-assisted Software Development 2025 report sets the following CFR benchmarks:
|
Performance tier |
CFR |
Notes |
|
Elite |
0 – 2% |
Only 16.7% of teams achieve this |
|
High |
2 – 5% |
Strong performance; deployments are mostly reliable |
|
Medium |
10 – 15% |
Systemic issues with testing or deployment process likely |
|
Low |
Above 15% |
High rates (45-60%) indicate near-constant production failures |
The 2025 report tightened the elite bar to 0-2% from the 0-5% commonly cited in older references. Most competitors are still using the older figure. If you’re benchmarking against industry data, use the 2025 number.
Only 16.7% of teams achieve elite-level CFR. That number is worth sitting with. It means the majority of engineering teams (including teams at well-resourced companies with mature DevOps practices) are regularly deploying code that causes production failures.
Industry context matters
A fintech team with regulatory deployment gates and SOX compliance requirements deploying weekly with a 5% CFR is performing exceptionally well for their context. A consumer SaaS team deploying 20 times a day with the same 5% CFR has significant room to improve.
DORA’s benchmarks are baselines, not universal targets. The most meaningful comparison is your own trend over time. CFR trending down quarter-over-quarter, regardless of where you start, is the real signal of a healthy delivery culture.
What Causes a High Change Failure Rate?
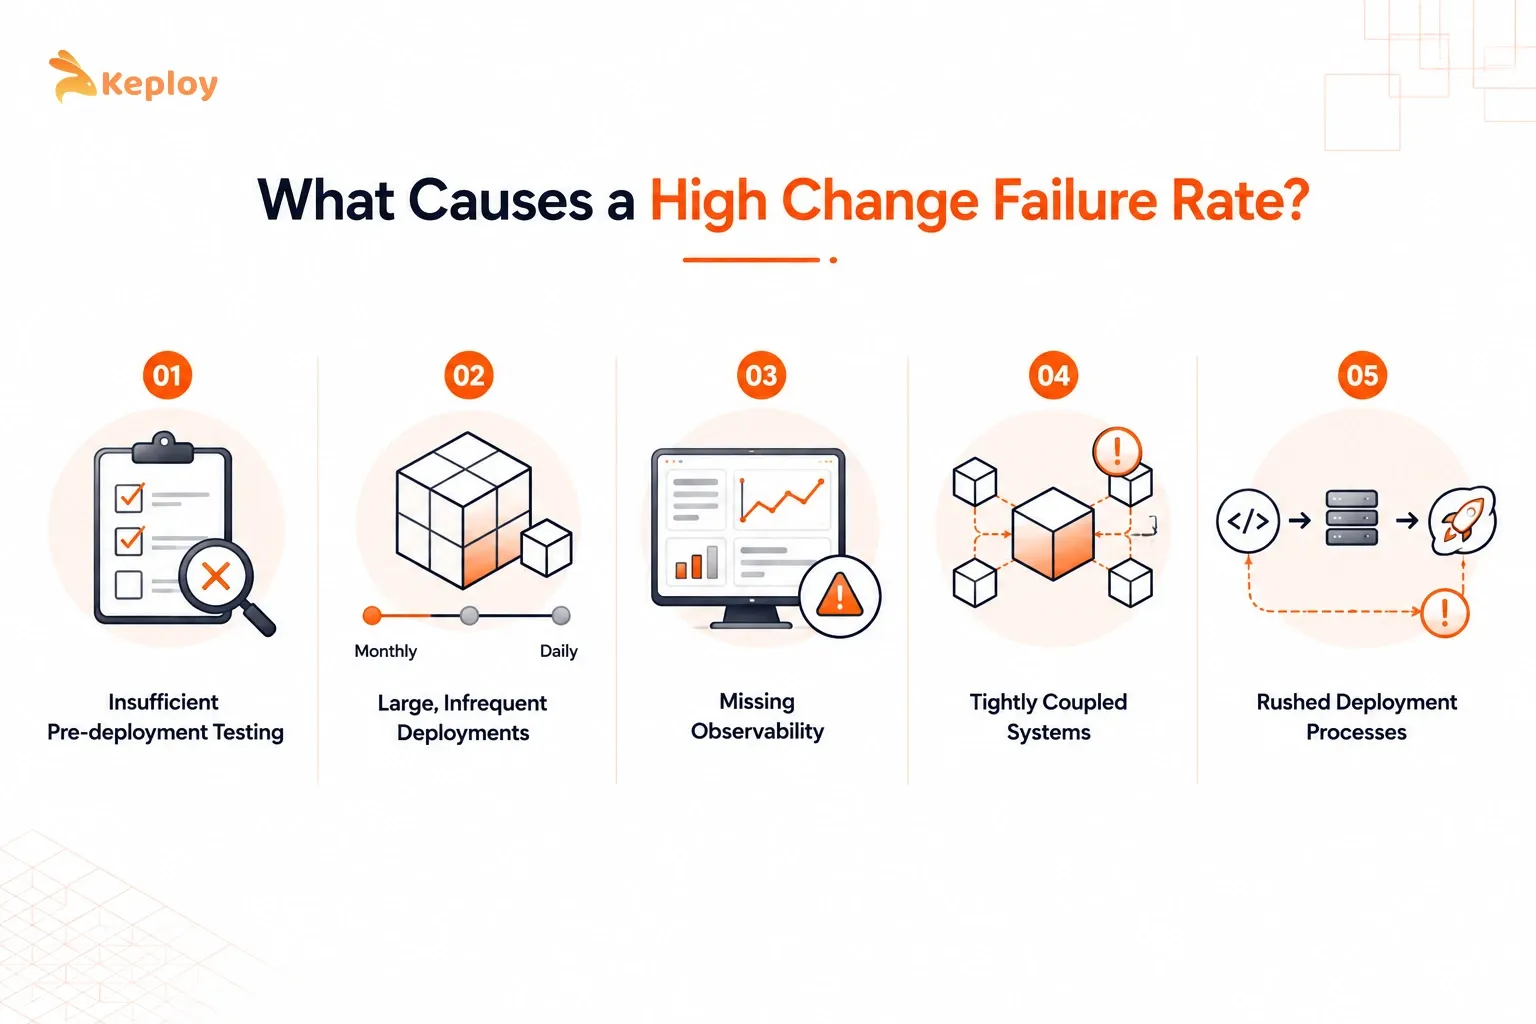
Understanding what drives CFR up is the first step to bringing it down. The causes fall into a few consistent patterns.
Insufficient pre-deployment testing: This is the root cause in the majority of cases. Tests that don’t cover the code paths most likely to fail in production leave gaps that only real users discover. Unit tests catch logic errors. Integration tests catch component interaction failures. API regression tests catch the behavioral changes that break downstream consumers. Each layer of missing test coverage is a category of failures that will show up in production instead of CI.
Large, infrequent deployments: The bigger the change set, the harder it is to identify which change caused a failure and the greater the blast radius when something goes wrong. Teams deploying monthly bundles of hundreds of commits have a harder time maintaining low CFR than teams deploying smaller changes daily.
Missing observability: Without structured logs, metrics, and distributed tracing, teams often don’t know a software deployment caused a failure until users report it. By that point, the failure window has already inflated the CFR. Detection speed is part of the CFR equation.
Tightly coupled systems: When services share too many assumptions about each other’s interfaces and behavior, a change in one service can break several others unexpectedly. This is particularly common in organizations that built their architecture quickly and haven’t invested in API contracts.
Rushed deployment processes: Skipping code review, deploying directly to production without a staging validation step, or bypassing automated tests "just this once" are consistent predictors of CFR spikes.
How to Reduce Change Failure Rate in DevOps
Strengthen Your Testing Pipeline to Prevent Regressions
The most direct lever on CFR is catching more failures in CI before they reach production. Every bug caught in a pipeline run is one that doesn’t contribute to your failure rate.
The class of production failures most likely to spike CFR is regressions: behavior that worked correctly before a deployment and breaks after it. These are particularly dangerous because they’re hard to anticipate: the code looks correct, the new feature works, but something that was already working has quietly stopped.
API-level regressions are the most common category in distributed systems. An endpoint changes its response structure, a field gets renamed, a status code changes, and every service that depends on that endpoint breaks. Manually authored API tests go stale as APIs evolve. Teams often don’t notice the coverage gap until a regression reaches production.
Keploy captures real API traffic from production and staging environments and converts those request-response interactions into regression tests that run in CI. Because the tests are derived from actual usage patterns rather than manually anticipated scenarios, they cover the edge cases that matter most: the ones real users trigger. When a deployment changes an API’s behavior in a way that breaks existing interactions, the failure surfaces in the pipeline before it reaches production rather than after.
Teams using this approach find that CFR improvements come from two directions: fewer regressions reach production, and when they do, engineers already have test cases that reproduce the failure, which compresses diagnosis time, reducing MTTR simultaneously.
Shift to Smaller, More Frequent Deployments
Trunk-based development means merging frequently to main rather than maintaining long-lived feature branches. It reduces the size of each deployment’s change set. Smaller change sets mean narrower blast radius when something does fail, and easier root cause identification when it does.
Feature flags decouple deployment from release. Code ships to production but remains inactive until deliberately enabled. This lets teams deploy continuously without exposing incomplete features, and roll back feature behavior instantly without a full redeployment.
Meta has used trunk-based development at scale for years. The discipline of short-lived branches and frequent integration is directly correlated with lower CFR because the surface area of each change is smaller.
Use Progressive Deployment Strategies
Canary releases route a small percentage of traffic (typically 1-5%) to a new deployment before full rollout. Error rates from the canary group signal problems before they affect all users. Amazon’s deployment pipelines use error rate thresholds to automatically expand or roll back canary deployments without human intervention.
Blue-green deployments maintain two identical production environments. New deployments go to the inactive environment first. Traffic switches only after validation. Rollback is a single traffic redirect rather than a redeployment.
Both approaches reduce CFR’s impact: fewer users experience any individual failure, and the window for detection and rollback narrows significantly.
Automate Rollback on Error Rate Thresholds
The faster a failed deployment is reversed, the less it contributes to both CFR and MTTR. Manual rollback processes (where an engineer has to identify the failure, decide to roll back, and execute the process) introduce delay at every step.
Automated rollback triggers on error rate spikes remove human reaction time from that sequence. When error rates exceed a defined threshold within a defined window after deployment, the previous version restores automatically. GitHub Actions, ArgoCD, and most modern CD platforms support this natively.
Run Blameless Postmortems After Every CFR Spike
Every production failure is data. A blameless postmortem documents what happened, what the system state was that allowed it to happen, and what would prevent the same failure category from recurring.
Teams that run structured postmortems consistently see CFR trend downward because each incident produces a process change or a new test case. The failure informs the shift-left investment. That’s the feedback loop that makes both CFR and test coverage improve together over time.
Change Failure Rate and AI Coding in 2026
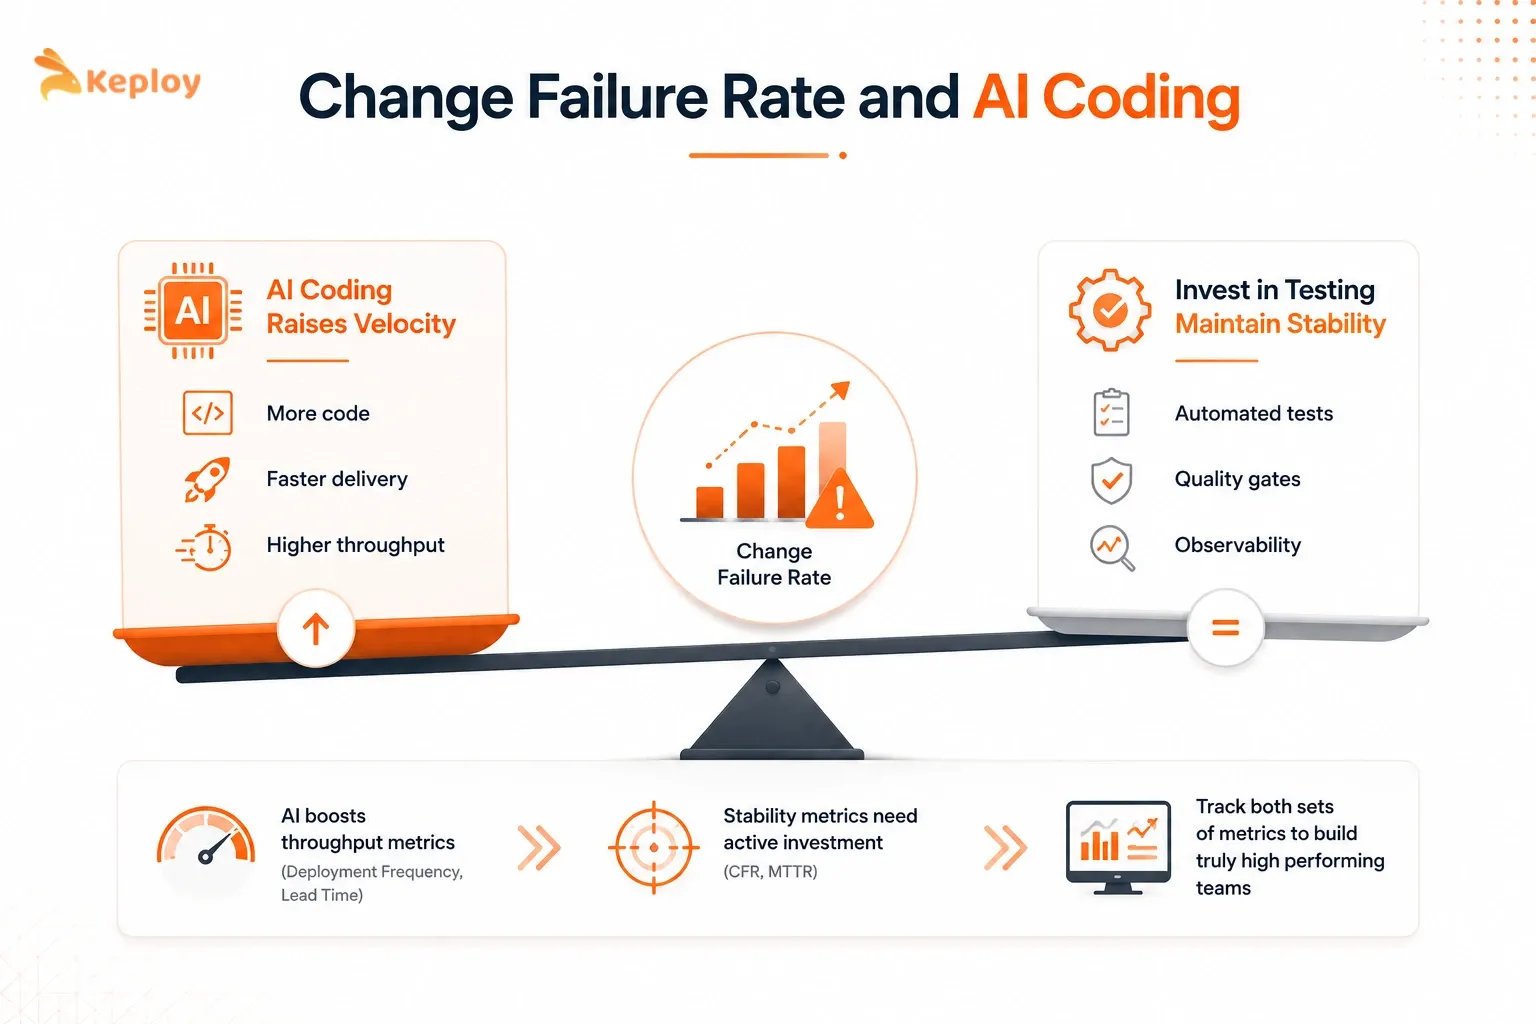
AI coding tools raise deployment velocity. More code ships faster with less manual effort. But the 2025 DORA report specifically notes that AI adoption hasn’t yet demonstrated a corresponding improvement in CFR.
The reason is straightforward: AI generates code, but it doesn’t automatically generate tests for that code. If a team’s testing pipeline stays the same while deployment frequency doubles, CFR will likely worsen. More deployments with the same proportion of untested behavior means more absolute failures.
The teams maintaining low CFR while using AI coding tools are the ones investing proportionally in automated testing. They’re treating test generation as an equal priority to code generation. More generated code with unchanged test coverage is a recipe for CFR inflation.
This is the tension the 2025 DORA report flagged most clearly: AI raises throughput metrics (deployment frequency, lead time) while stability metrics (CFR, MTTR) require active investment to keep pace. Teams that only track the throughput metrics will see the numbers look better while the underlying system becomes less stable.
Conclusion
Change failure rate is the metric that tells you whether your deployment speed is working for you or against you. A falling CFR alongside stable or rising deployment frequency is the signature of a team that’s gotten the fundamentals right: smaller changes, stronger tests, better observability, and the discipline to learn from every failure.
What’s hard isn’t the calculation. It’s building the system that keeps that number below 2% consistently. Start with the testing pipeline. Track your trend over time. Use every CFR spike as a data point rather than a problem to move past quickly.
The teams at 0-2% didn’t get there by accident. They built the practices, and the metric followed.
Frequently Asked Questions
What is change failure rate in DORA metrics?
Change failure rate (CFR) is one of the five DORA metrics, measuring the percentage of production deployments that result in a failure requiring remediation. It sits in the stability half of the DORA framework alongside MTTR, and together they measure whether deployment speed is creating sustainable reliability or just faster failures. A low CFR means deployments are reliable. A high CFR means the team is regularly shipping code that breaks in production.
What is a good change failure rate?
Per the DORA State of AI-assisted Software Development 2025 report, elite teams achieve a CFR of 0-2%. Only 16.7% of teams reach this level. High-performing teams operate between 2-5%. A CFR above 15% consistently signals systemic issues in testing or deployment process. Context matters: a fintech team deploying weekly with 5% CFR may be performing at elite level for their regulatory environment, while a SaaS team deploying 20 times daily with 5% CFR has significant room to improve.
How do you calculate CFR?
CFR = (Number of failed deployments ÷ Total number of deployments) × 100. Count a deployment as failed if it required a rollback, hotfix, or emergency patch. Exclude fix-only deployments (already remediation) and failures caused by external factors outside your code. Use a 30-day window for operational monitoring or 90 days for trend analysis.
What counts as a failure in change failure rate?
Rollbacks, hotfixes deployed within 24-48 hours of a production change, and P1/P2 incidents directly caused by a deployment all count. Fix-only deployments, third-party outages, and infrastructure failures unrelated to your code change don’t count. The fix-only exclusion is the most commonly misapplied rule. A hotfix deployment that itself causes a new failure counts as an additional failure, but the original incident that triggered the hotfix doesn’t.
What is the difference between CFR and MTTR?
CFR measures how often deployments fail. MTTR measures how long it takes to recover when they do. CFR is a pre-deployment quality signal. It reflects testing pipeline strength, deployment discipline, and code review thoroughness. MTTR is a post-incident recovery signal. It reflects observability, rollback automation, and incident response maturity. The two metrics move together: teams with high CFR almost always have high MTTR, because the same practices that reduce failures also enable faster recovery.
How does AI coding affect change failure rate?
AI tools raise deployment frequency but don’t automatically improve CFR. If test coverage doesn’t scale with AI-generated code volume, CFR worsens even as other metrics improve. The 2025 DORA report flagged this specifically: teams using AI coding tools that only invest in throughput see stability metrics degrade. The teams maintaining low CFR with AI assistance are investing proportionally in automated test generation alongside code generation.
What is the fastest way to reduce CFR?
Strengthen the pre-deployment testing pipeline first, specifically for the failure category most likely to cause your CFR spikes. For API-heavy backends, that’s usually API regression coverage. For frontend-heavy products, it’s E2E test coverage of critical user flows. Then move to smaller deployment batches. Trunk-based development with feature flags reduces blast radius immediately. Progressive deployment strategies (canary releases, blue-green) limit user exposure while the deployment is validated.
What tools track change failure rate?
DORA metric dashboards like LinearB, Faros, and Haystack aggregate deployment data and incident data to calculate CFR automatically. PagerDuty and OpsGenie link incident data to deployment events. GitHub, GitLab, and Jira provide the deployment timestamps and incident correlations these tools need. Most teams start by manually tracking CFR in a spreadsheet using deployment logs and incident postmortems, then graduate to automated tools once the measurement discipline is established.

Leave a Reply